Figures & data
Figure 1. Correlations between methylation levels (beta values) at ER stress genes and WC after adjustments for age and sex. (A) cg08188400, MAP2K7 (B) cg20541779, CASP12 (C) cg24776411, EIF2AK1 (D) cg14190817, HSPA5 (E) cg21376454, ERN1 (F) cg06666486, EIF2AK1 (G) cg03211481, DNAJC1 (H) cg18357645, OS9 (I) cg05801879, MBTPS1 (J) cg20964082, ERO1LB (K) cg17300868, NFE2L2 (L) cg03384128, EIF2AK4 (M) cg02712587, EIF2AK4 (N) cg04972384, SELS (O) cg02240686, EIF2AK2.
Figure 2. Tenth, 25th, 50th, 75th, and 90th percentiles of methylation levels (beta values) at ER regulatory genes by categories of insulin, HOMA-IR and triglycerides after adjustments for age and sex in subjects with excessive weight. (A) cg17300868, NFE2L2 (B) cg20964082, ERO1LB (C) cg17300868, NFE2L2 (D) cg20964082, ERO1LB (E) cg05801879, MBTPS1 (F) cg03384128, EIF2AK4. a p < 0.0001. b p < 0.05.
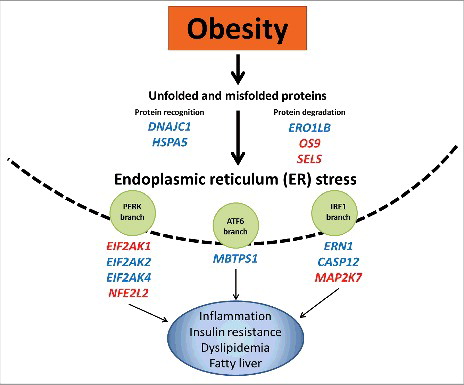
Figure 3. Epigenetic regulation of endoplasmic reticulum stress in obesity and associated metabolic diseases. Obesity induces a chronic activation of the unfolded protein response and consequently ER stress. Differentially methylated ER regulatory genes play a pivotal role in obesity-induced ER stress, leading to the development of metabolic disturbances. Hypomethylated (red color); hypermethyated (blue color).