Figures & data
Figure 1. The ex vivo effects of CL and CL + ghrelin combination treatments on lipolysis as measured by glycerol (a and d) and free fatty acid (b and e) release and fatty acid reesterification (c and f) in subcutaneous inguinal white (top) and visceral retroperitoneal (bottom) adipose tissue. Data were analyzed using a repeated measures two-way ANOVA (n = 9–12) and expressed as mean ± standard error, in mM/g tissue/2h. Data sharing a letter are not statistically different from each other. p < 0.05 was considered statistically significant.
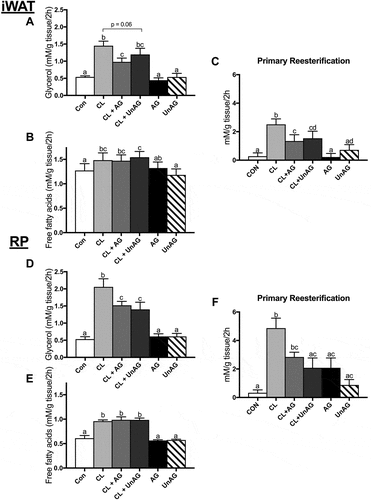
Figure 2. The ex vivo effects of GH and GH + ghrelin or CL combination treatments on lipolysis as measured by glycerol (a and d) and free fatty acid (b and e) release and fatty acid reesterification (c and f) in subcutaneous inguinal white (top) and visceral retroperitoneal (bottom) adipose tissue. Data were analyzed using a repeated measures one-way ANOVA (n = 6–8) and expressed as mean ± standard error, in mM/g tissue/2h. Data sharing a letter are not statistically different from each other. p < 0.05 was considered statistically significant.
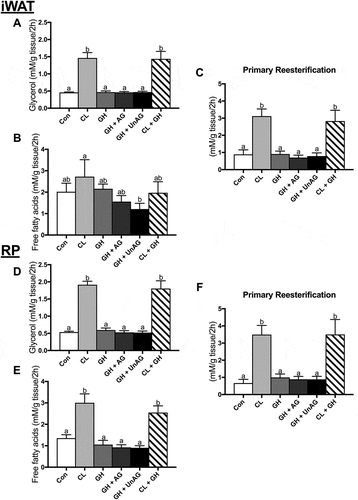
Figure 3. The ex vivo effects of CL and CL + ghrelin combination treatments on the activation of lipolytic enzymes ATGL and HSL in subcutaneous inguinal white (a) and visceral retroperitoneal (b) adipose tissue. Data were analyzed using a repeated measures one-way ANOVA (n = 6–12) and expressed as mean ± standard error, in arbitrary protein units (phospho/total). Data sharing a letter are not statistically different from each other. p < 0.05 was considered statistically significant.
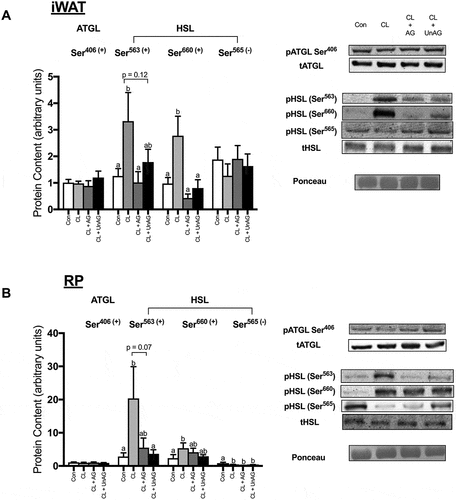
Figure 4. The ex vivo effects of CL and CL + ghrelin combination treatments on the activation of ERK, the cellular energy-sensing enzyme AMPK and its downstream target ACC in subcutaneous inguinal white (a) and visceral retroperitoneal (b) adipose tissue. Data were analyzed using a repeated measures one-way ANOVA (n = 8–10) and expressed as mean ± standard error, in arbitrary protein units (phospho/total). Data sharing a letter are not statistically different from each other. p < 0.05 was considered statistically significant.
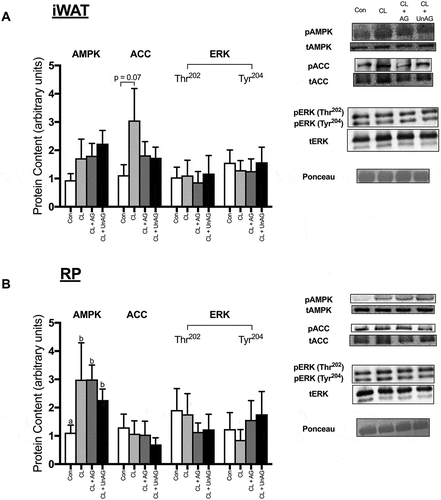
Figure 5. The in vivo effects of CL and CL + ghrelin co-injections on lipolysis as measured by circulating glycerol (a) and free fatty acid (b) release and fatty acid reesterification (c). Data were analyzed using a repeated measures one-way ANOVA (n = 7–8) and expressed as mean ± standard error, in mM. Data sharing a letter are not statistically different from each other. p < 0.05 was considered statistically significant.
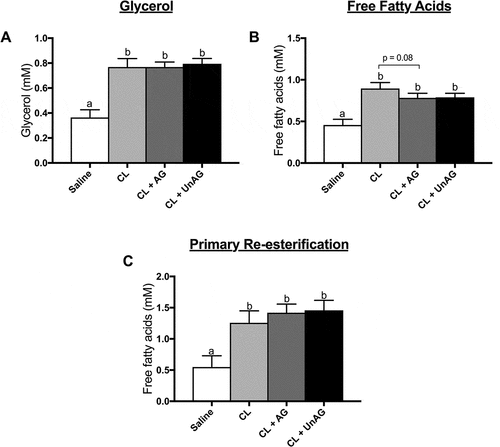
Figure 6. The in vivo effects of CL and CL + ghrelin co-injections on the activation of lipolytic enzymes ATGL and HSL in subcutaneous inguinal white (a) and visceral retroperitoneal (b) adipose tissue. Data were analyzed using a repeated measures one-way ANOVA (n = 6–8) and expressed as mean ± standard error, in arbitrary protein units (phospho/total). Data sharing a letter are not statistically different from each other. p < 0.05 was considered statistically significant.
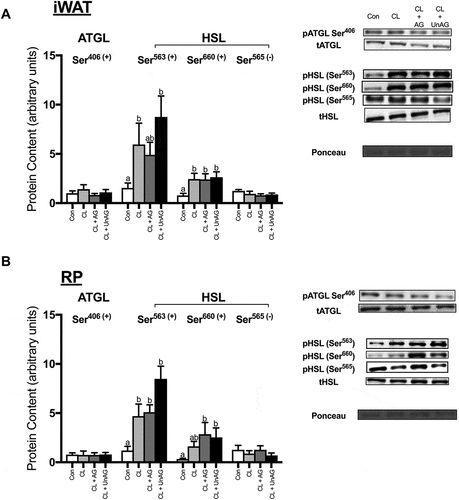
Figure 7. The in vivo effects of CL and CL + ghrelin co-injections on the activation of ERK, the cellular energy-sensing enzyme AMPK and its downstream target ACC in subcutaneous inguinal white (a) and visceral retroperitoneal (b) adipose tissue. Data were analyzed using a repeated measures one-way ANOVA (n = 6–8) and expressed as mean ± standard error, in arbitrary protein units (phospho/total). Data sharing a letter are not statistically different from each other. p < 0.05 was considered statistically significant.
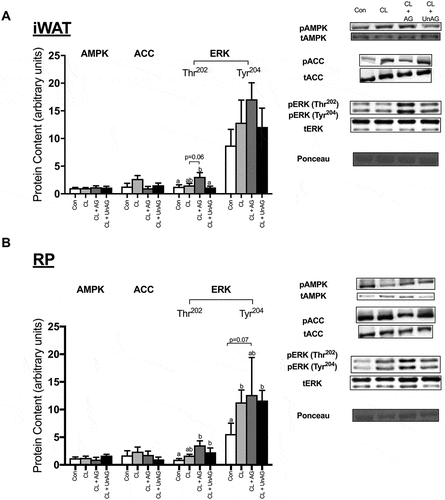
Table 1. The in vivo effect of CL and CL + ghrelin combination treatments on AKT phosphorylation (a marker of insulin signaling activation) in subcutaneous iWAT and visceral RP adipose tissue depots (arbitrary units, phospho/total, normalized for ponceau) and serum insulin concentrations (ng/ml). Data are expressed as mean ± standard error. Data were analyzed using a repeated measures one-way ANOVA (n = 6–8). Data sharing a letter are not statistically different from each other. p < 0.05 was considered statistically significant.
