Figures & data
Figure 1. Summary of the potential change in glucose utilisation by brown and beige fat between (A) warm and (B) cool ambient temperature increases. Overall the fraction of whole body-glucose utilisation increases in parallel with an increase in the amount of brown and beige fat, but this is lower in the warm. It is based on calculated estimates of glucose oxidation in adult humans as determined in the cold (e.g.Citation13) or after feeding (e.g.Citation40).
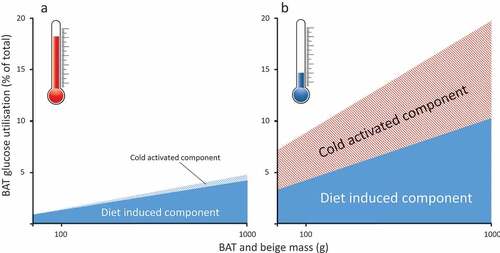
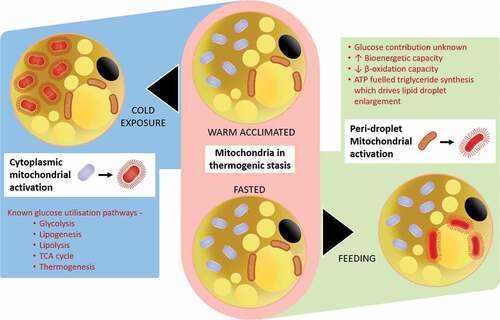
Figure 2. Summary of the potentially different responses between the peridroplet and cytoplasmic mitochondrial fractions within brown (and beige) fat to oxidative metabolism in response to diet or cold-exposure.