Figures & data
Table 1. WAT site cell characteristics of young male Wistar rats.
Figure 1. Production of lactate by RBCs incubated in medium with 14 mM glucose The data are the mean ± sem of 4 samples of adult rat blood. The blue dots and line coprrespond to samples of blood washed and processed in the same way than tissue extracts. Red dots and line are the results of direct incubation of whole fresh blood, The X axis represents the the number of RBC per well and the Y axis the amount of lactate released in micromoles per day. The p values represented in the Figure correspond to the statistical significance if the correlation between cell numbers and lactate efflux. No statistically significant differences were appreciated between the values for fresh blood and washed RBCs.
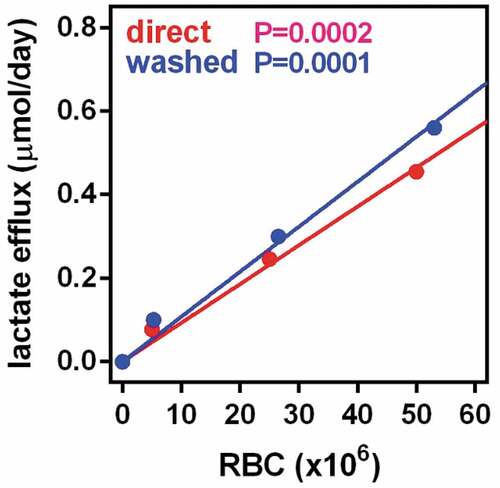
Table 2. WAT site cell glucose uptake and metabolite efflux of young male Wistar rats.
Figure 2. Glucose uptake, and lactate, glycerol and NEFA efflux from WAT component cells corresponding to 1 g of tissue SC = subcutaneous WAT (blue); MES = mesenteric WAT (red); EPI = epidydimal WAT (green). Full columns = 7 mM glucose, white-dashed columns = 14 mM glucose. The data are the mean ± sem of two-rat pooled samples (N = 4; N = 3 for 14 mM glucose in MES and EPI) obtained from adult male rats. The data for glucose uptake and lactate efflux correspond to the number of adipocytes, NSC and RBC contained in 1 g of tissue () multiplied by their individual uptake/efflux data (). The data for glycerol and NEFA correspond exclusively to the adipocytes present in 1 g of tissue, since no efflux of either was observed in NSC or RBC. Statistical significance of the differences between groups (2-way ANOVA): the data for site in adipocytes and NSC are indicated in the Figure itself, the absence of data indicates that the differences, if any, were not significant (P > 0.05); no significant differences were observed for the effect of initial glucose concentration.
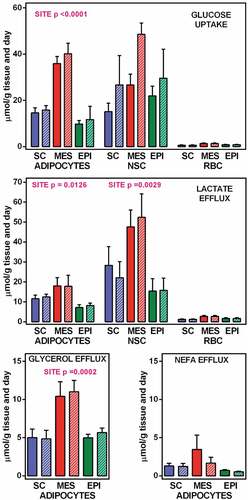
Table 3. WAT site expression (in specific mRNA copies per cell) of genes related with glycolysis and glycerol metabolism of young male Wistar rats.
Table 4. List of primers used.
Figure 3. Number of copies of glycolysis-related genes in adipocytes and NSC contained in 1 g of WAT from different sites (SC, MES and EPI) or male adult rats The data correspond to the mean ± sem of two-rat pooled samples (N = 4 or N = 3 in the groups indicated in ). The data have been presented in a of magnitude logarithmic scale (with more than five orders of magnitude span) for easy direct comparison of the abundance of all gene transcripts. The values shown were calculated from the data presented in and . Dot and line colours are represented in the Figure: Adipocytes: orange A SC, red A MES, yellow A EPI; NSC: light blue NSC SC, blue NSC-EPI, green NSC-EPI., Statistical significance of the differences between groups (3-way ANOVA). T: corresponds to differences between the ‘type’ or cell (adipocyte vs. NSC), in black, S: refers to the differences between ‘sites’ (SC, MES, EPI) within the same cell group, in purple, and G represents the statistically significant differences in expression induced by the initial ‘glucose’ concentrations, in blue.
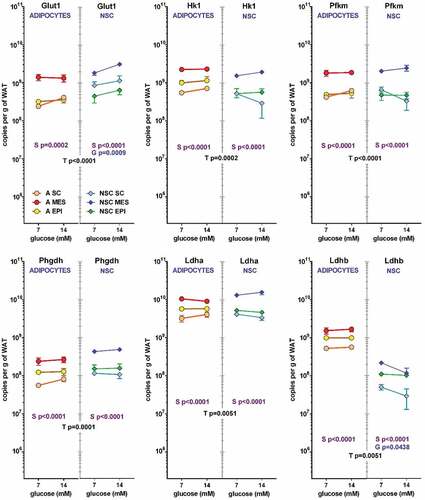
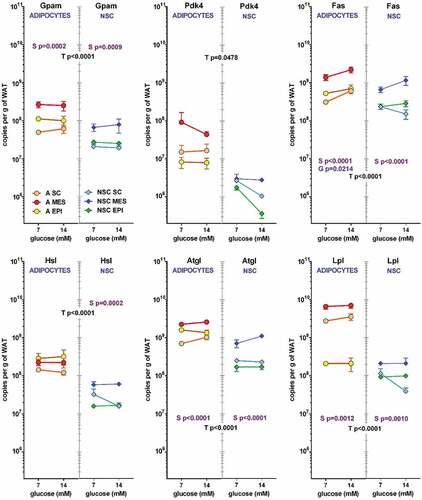
Figure 4. Number of copies of glycerol and lipid metabolism-related genes in adipocytes and NSC contained in 1 g of WAT from different sites (SC, MES and EPI) or male adult rats The data correspond to the mean ± sem of 4 different two-pooled rat samples. All conventions are the same described for .