Figures & data
Figure 1. Culture media and oleic acid influence 3T3L1-MBX adipocytes. 3T3L-MBX fibroblasts were differentiated in vitro then treated with culture media containing glucose at either 1 g/L (low LG), 4.5 g/L (high HG), insulin (INS 0,01 mU/mL) and/or oleic acid (OA 10 µM) versus vehicle (Control C) during 24 h. (a) Bright field imaging of poorly (Day 10 post-differentiation) versus highly differentiated (D17) adipocytes treated during 24 h. (Scale bars = 50 µm). (b) Triglycerides (TG) content analysis by fluorescent quantification (CFU) of AdipoRed normalized to Hoechst 33258 (nuclei, i.e. cell number, upper) and size distribution of cells treated in HG (lower) without or with oleic acid (10 µM). (c) Lipid droplet size and number analyzed by AdipoRed counts normalized to those of Hoechst (X4 magnification on at least 5 fields) in several medias. (d) Effect of treatment with OA (10 µM) in HG media.
Figure 2. Dose-response of partially differentiated 3T3L1-MBX adipocytes (D5) to oleic acid (OA) during 24 h (High glucose). (a) RTCA analysis of dose-dependent response to OA is highly sensitive and reveals cell adhesion force reduction due to TG accumulation within few hours. IC50 was of 1.5 µM and allowed TG accumulation up to 5 µM (B). Higher concentrations of OA increased droplet volumes (i.e. TG accumulation) and number (until 5 µM), thus increasing intracellular TG content in a dose-dependent manner to OA concentration. (c) Bright field and fluorescent merged images of cell cultures (objective x4, upper panels) nuclei were labeled with Hoechst 33258 (red) and lipid droplets with AdipoRed (green), lower line (objective x20, lower panels).
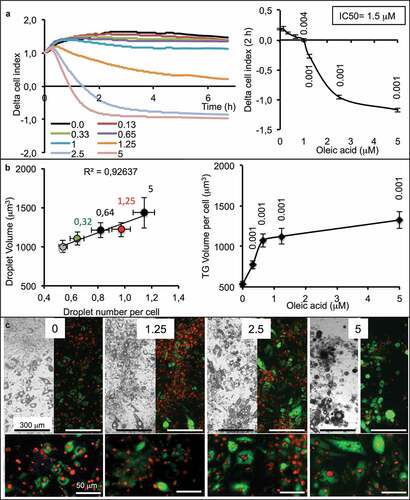
Figure 3. Influence of co-culture media in TG storage by 3T3L1-MBX adipocytes co-cultured with intestinal barriers. (a) Real-time analysis of adipocytes co-cultured with intestinal barriers Caco-2 or Caco-2/HT29-MTX (BI, left panel) and TG content after 24 h (right panel). TG content in (B) adipocytes and (C) intestinal barriers (BI) versus primed (BIP) 24 h after co-culture in either low (LG) or high (HG) glucose media with insulin (INS 0.01 mU/mL). Data are presented as mean values ± SEM (n = 8) with significant Student t-test p-values (p < 0.05) or Anova variances (letters).
Figure 4. 3T3L1-MBX adipocytes sensing of oleic acid (OA) pre-absorbed by intestinal barriers Caco-2 and Caco-2/HT29-MTX (BI). (a) Real-time analysis of adipocytes (left upper panel) co-cultured with BI pre-treated 2h with OA 10 or 100 µM or control media (co-culture in HG media) reveals significant TG accumulation after AdipoRed lipid droplet volume analysis (right upper panel). (b) Comparative sensing in adipocytes 24 h after co-culture with either Caco-2 or Caco-2/HT29-MTX (BI) pre-treated with several doses of OA (μM). Data are presented as mean values ± SEM (at least 5 replicates) with Anova variances (letters). Corresponding merged AdipoRed (green) and Hoechst 33258 (red) images were acquired at either x4 or x20 magnification using imaging parameters normalized to controls.
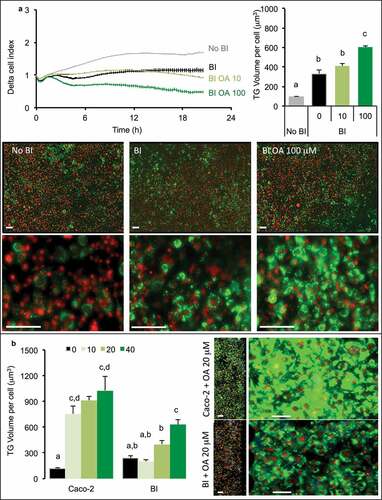
Figure 5. Oleic acid (OA)-induced TG retention in Caco-2 or in Caco-2/HT29-MTX (BI) 24 h post-treatment. Caco-2 and BI, pre-treated with OA 10 µM during 2 h were then maintained in culture media (HG) during 24 h before analysis of TG content using AdipoRed labeling. Data are presented as mean values ± SEM (8 replicates) with Anova variances (letters). Corresponding merged AdipoRed (green) and Hoechst 3358 (red) images were obtained at identical acquisition parameters using objective x4.
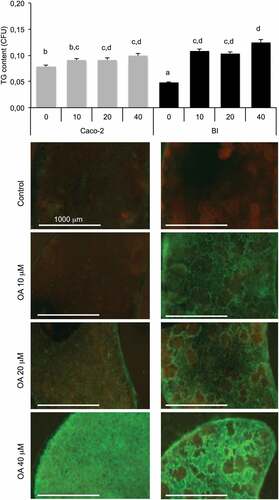
Figure 6. Lipid content in intestinal barriers pre-treated or not with GLP2 and in 3T3L1-MBX adipocytes. Intestinal barriers Caco-2/HT29-MTX without (BI) or with priming (BIP) were pre-treated with GLP2, 125 ng/mL during 2 h then co-cultured with 3T3L1-MBX adipocytes during 24 h in either low (LG) or high glucose (HG) containing insulin (INS 0.01 mU/mL). Contents of triglycerides (TG) were monitored using AdipoRed labeling and normalization to time of starting co-cultures (T0). Data are presented as mean values ± SEM (8 replicates) with Anova variance (letters).
Figure 7. Dose-response of hepatocytes AML12 to oleic acid (OA) after 24 h. (a) Real-time analysis of OA uptake by enterocytes AML12 (left panel) and corresponding slopes and IC50 (right panel). Data are presented as mean values ± SEM (8 replicates). (b) OA-induced TG accumulation monitored by cytometry analysis of AdipoRed fluorescence. Mean AdipoRed-H was analyzed on living cell populations in duplicates (right panel). (c) Merged images of AdipoRed (green) and Hoechst 33258 (red) acquired with identical parameters with objective x20. Significant Student t-test-p-values are reported for p < 0.05, compared to control.
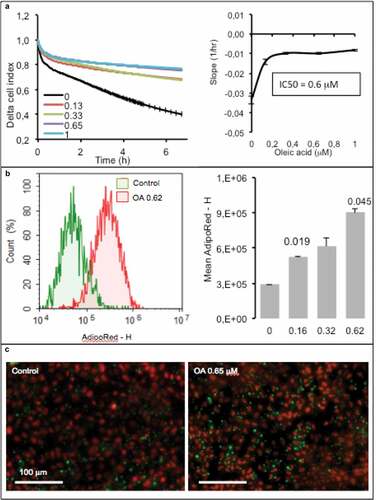
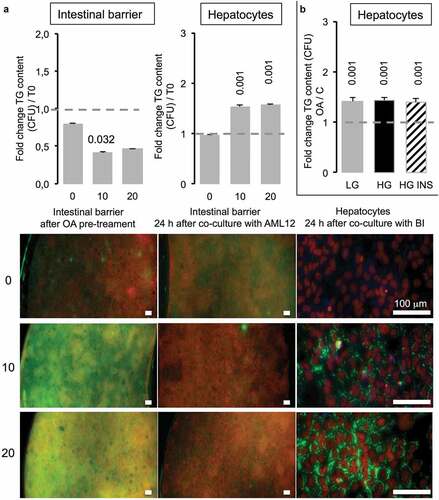
Figure 8. Caco-2/HT29-MTX intestinal barriers pre-treated with oleic acid (OA) in co-culture induce TG accumulation in AML12 hepatocytes. (a) Intestinal barriers were pre-treated with either 10 or 20 μM OA during 2 h then OA was removed by replacing media and intestinal barrier 96-wells inserts were loaded onto AML12 hepatocytes during 24 h in HG media. TG accumulation was assessed using AdipoRed fluorescent intensities normalized to time of pre-treated intestinal barrier before loading onto AML12 cells in either Caco-2/HT29-MTX (T0) or 24 h after co-culture (A) and AML12 cells. Corresponding images are presented as merged AdipoRed (green)/Hoechst 33258 (red) images at magnification x4 (96-wells inserts) or x20 (AML12). Dot line at 1 represents the value for control at T = 0. (b) AML12 sensing of intestinal barriers pre-treated with OA (10 µM) in co-culture media containing either low (LG) or high glucose (HG) with or without insulin (INS 0,05 mU/mL) after 24 h. Data are presented as mean values ± SEM (n = 8) with significant Student t-test p-values <0.05 compared to T0.