Figures & data
Figure 1. Measurement of the effect of KD025 on adipogenesis in hADSCs.
hADSCs were differentiated by culturing in differentiation media (DM) with or without KD025 at the indicated concentrations. (a) Experimental scheme of differentiation. (b) Cells were stained with ORO at day 15, and microscopic images were taken after the start of differentiation (indicated as day 0). Cells were exposed to 0.3, 0.5, 1, and 3 μM of KD025. (c) Lipid accumulation of (b) was assessed by measuring absorbance at 520 nm. (d) Cells were differentiated with or without 3 μM KD025 until day 24. Microscopic pictures of cells are presented. (e) Lipid accumulation of (d) was assessed by measuring absorbance at 520 nm. **p < 0.01; ***p < 0.001 vs. control.
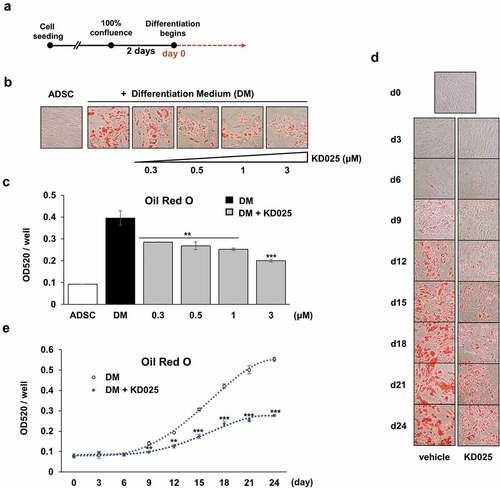
Table 1. List of real time PCR primers and sequences.
Figure 2. Effect of KD025 on fate determination of human stem cells.
hADSCs were differentiated with or without 3 μM KD025 for the indicated periods. (a) The number of ORO-stained cells, which are considered adipocytes, were counted in each group from 30 different areas of the obtained microscopic images. (b) All cells were trypsinized, and total number of cells was counted using a hemocytometer. The total number of cells at each time point was expressed as a ratio to the total cell number at the differentiation starting point. *p < 0.05, **p < 0.01; ***p < 0.001 vs. control.
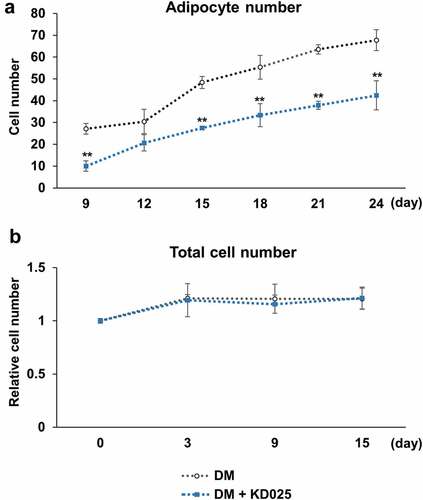
Figure 3. Effect of KD025 on adipogenic and lipogenic markers.
hADSCs were differentiated by incubating in DM with or without 3 μM KD025 over 15-day period. (a) The protein expression levels of PPARγ and FABP4 were analyzed by Western blot, at the indicated time points. β-tubulin was used as a loading control. (b) The expression levels of PPARγ and FABP4 was quantified using the ImageJ software. The relative level was assessed by fold changes compared to day 6/KD025-untreated control cells. (c) The mRNA expression levels of adipogenic genes (PPARG, CEBPA, CEBPB) and lipogenic genes (SLC2A4, SREBF1) at the indicated time points. The relative level was assessed by fold changes compared to KD025-untreated control cells at day 0. *p < 0.05, **p < 0.01; ***p < 0.001 vs. corresponding control condition.
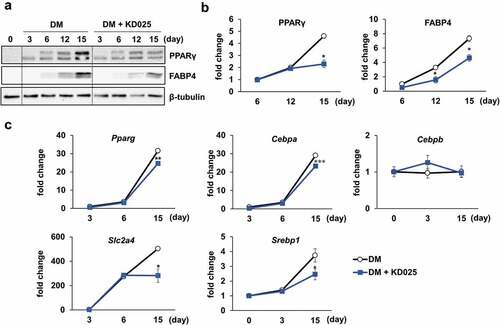
Figure 4. Stage-specific effect of KD025 on adipogenesis of hADSC.
(a) During differentiation of hADSCs, cells were exposed to 3 μM KD025 at various time schedules as indicated, and stained with ORO. The time schedules of inhibition are denoted as the corresponding rods, and the amount of lipid measured was indicated by the relative darkness of the color compared to DM treated group as 100%.(b) Lipid accumulation was assessed by measuring absorbance at 520 nm. The positive control treated for the entire period (from day 0 to day 21) is marked in orange. *p < 0.05, **p < 0.01 vs. positive control (orange box).
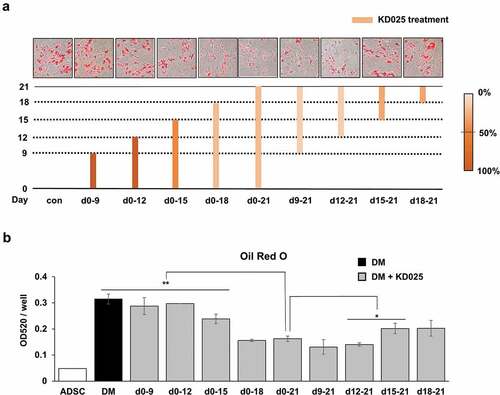
Figure 5. Effects of ROCK inhibitors on insulin signaling.
hADSCs were starved in serum-free medium and then stimulated with 20 nM insulin for 20 min. ROCK inhibitors were treated during starvation and stimulation periods. Western blot was performed to evaluate the level of p-Akt (Ser473), p-Akt (Thr308), Akt, and p-GSK-3α/β. β-tubulin was used as the loading control. (b) Band intensity of p-Akt (Ser473) and p-Akt (Thr308) was quantified using the Image J software. The relative level was assessed as fold changes compared to the unstimulated, vehicle-treated control cells. *p < 0.05, **p < 0.01 vs. control.
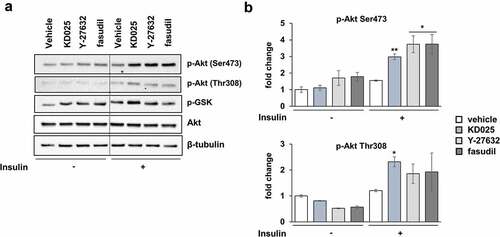
Figure 6. Effects of ROCK inhibitors on adipogenesis of hADSCs.
(a) During differentiation, cells were exposed to KD025 (3 µM), Y-27632 (5 µM), fasudil (5 µM) and H-1152P (3 µM). Cells were then stained with ORO on day 15. (b) Lipid accumulation was assessed by measuring absorbance at 520 nm. *p < 0.05, **p < 0.01; ***p < 0.001 vs. untreated.
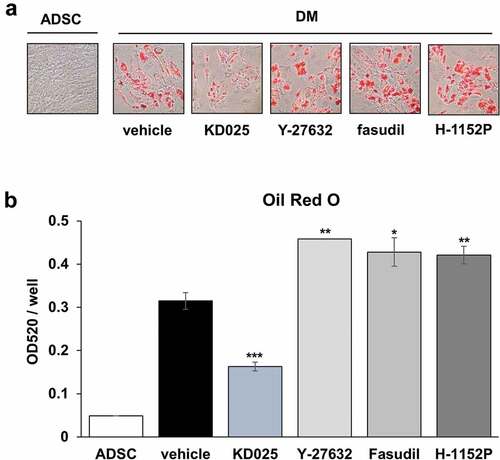
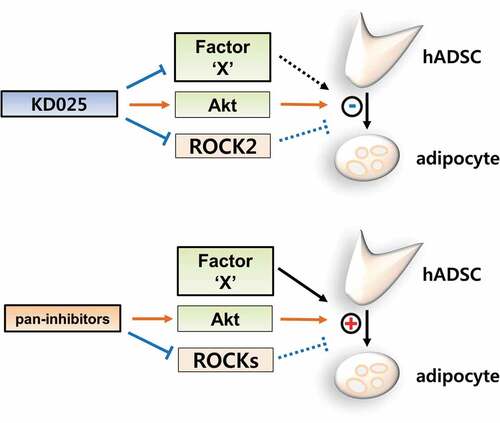
Figure 7. Proposed model of the mechanistic action of KD025 on the differentiation of hADSCs.
KD025 inhibits adipocyte differentiation in hADSCs by suppressing a certain pro-adipogenic regulator. This inactivation overwhelms the pro-adipogenic activity resulting from the Akt activation and ROCK inhibition. Pan-inhibitors promote adipogenesis by activating Akt and suppressing ROCKs.