Figures & data
Table 1. Groups undergone neural induction, their respective controls and maintenance medium.
Table 2. Primer sequences used for semi quantitative gene expression.
Table 3. Antibodies used for immunocytochemistry and western blot.
Figure 1. Immunofluorescence analysis displays the stemness of ADSCs (a). ADSCs exhibit embryonic stem cell marker (ESC) Nucleostemin, localized in the nucleolus, and Nanog homeobox, widely spread. Mesenchymal stem cell marker (MSC) CD105 is localized in the membrane, and CD166 is concentrated around the nucleus and diminished in the periphery (Magnification 20 x). Semi-quantitative gene expression analysis of the zinc finger protein ZNF521 in ADSC samples 1 and 2 (ADSCS1 and ADSCS2) from d 17 to d 52 (b), with GAPDH as an endogenous control.
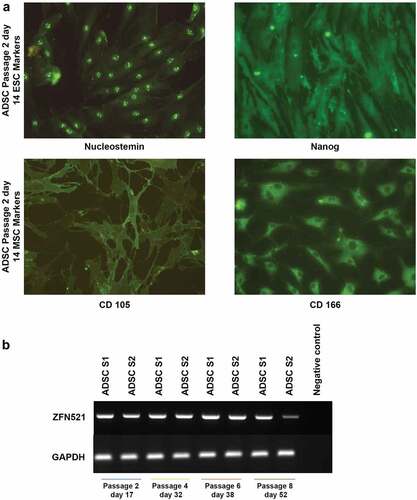
Figure 2. Morphological characterization of ADSCs and ADSCs after pre-induction. ADSCs expressed classic spindle-shaped fibroblastic structure of mesenchymal stem cells (a) ADSCs at 24 h after induction with only NIM exhibit sharply curved structures (b) ADSCs at 24 h after pre-induction with β-ME display cell shrinkage and clumping (c) ADSCs at 24 h after pre-induction with β-ME and 5-azacytidine (AZC) display more shrinkage, clumping, and micro-projections (d). (Magnification 10 x).
Figure 3. Morphological analysis using HE staining illustrates the stage-specific differentiation of ADSCs. At d 11 after induction, ADSCs treated with β-ME and NIM revealed a specific neuroprogenitor-like stage (group I) (a). At d 27 after induction, the neuroprogenitor-like cells become glial-lineage-like cells (group I) (b). At 27 d after induction, the ADSCs treated only with NIM also become glial-lineage-like cells (group II) (c). Poorly differentiated cells with small neurite extensions appeared at d 30 after neural induction with β-ME, NIM, and 5-azacytidine (group III). (Magnification10x).
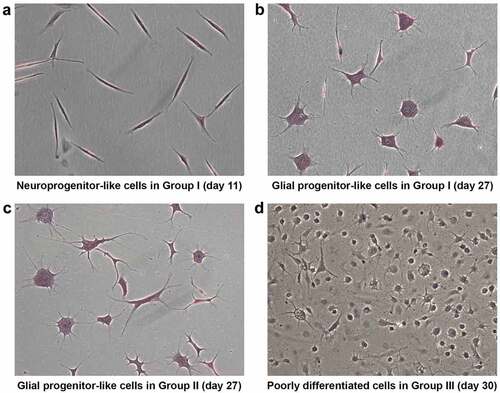
Figure 4. Morphological analysis of ADSCs after neural induction with and without 5-azacytidine (AZC) showed differences in differentiation pattern. At d 15 after neural induction with NIM without AZC, differentiating cells display networks resembling neural circuits (a). Non-differentiating cells at d 15 after neural induction with NIM and AZC display less differentiation (b). (Magnification10x).
Figure 5. Immunocytochemical analysis on d 11 after neural induction revealed a neuroprogenitor-like stage. The proliferative marker Nucleostemin is present in the nuclei of NPCs (a). Aminopeptidase N/CD13 is concentrated around the nuclei of NPCs (b). The pan-neural protein Gamma enolase/Neuron-specific enolase is widely expressed in NPCs (c). The T-SNARE protein SNAP25, which promotes membrane fusion, is present in the growth cone and vesicles in NPCs (white arrow denotes membrane fusion) (d). Neuromodulin/GAP43 is present in the growing tips (white arrow) of the elongated axons of NPCs (e). The intermediate filament NF-L is concentrated around the nuclei and is also present in the growth cones (solid white arrow) of NPCs (f). (magnification20x). . Semi-quantitative gene expression profiling by RT-PCR of ADSC-derived neural-lineage cells for three neural-induced samples from patients S1-3 at d 25 after induction with two different treatments: NIM with β-ME (WBME) and without β-ME (W/O BME). Untreated ADSCs used as control.
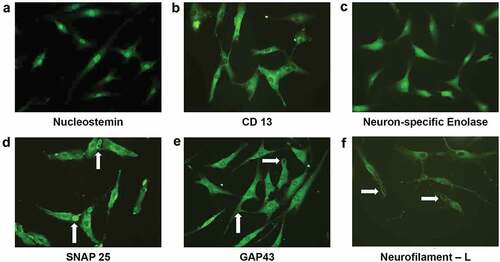
Figure 6. Semi-quantitative gene expression profiling by RT-PCR of ADSC-derived neural-lineage cells for three neural-induced samples from patients S1-3 at d 25 after induction with two different treatments: NIM with β-ME (WBME) and without β-ME (W/O BME). Untreated ADSCs used as control.
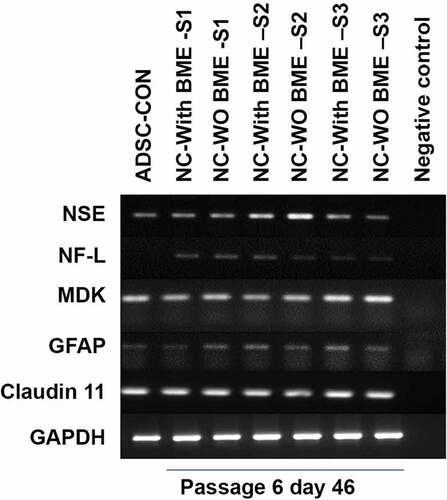
Figure 7. Western blot analysis of ADSC-derived neural-lineage cells for two neural-induced samples from patients S1 and S2 at d 25 after induction with two different treatments: NIM with β-ME (WBME) and without β-ME (W/O BME). Untreated ADSCs used as control.
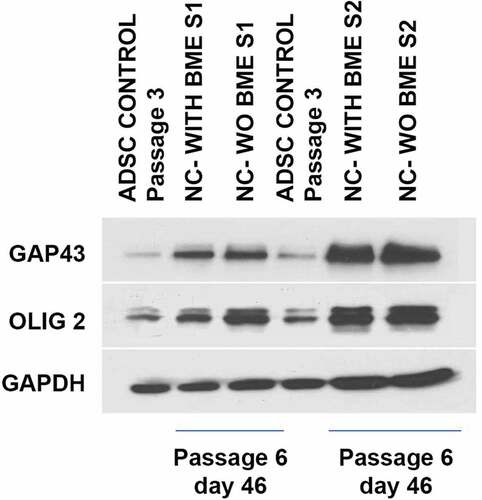
Figure 8. Immunocytochemical analysis of ADSCs on d 30 after induction (a), with β-ME, NIM, and AZC showed NSE positivity and NF-L negative. The resultant cells are spheroids with minute neurite projections, resembling poorly differentiated structures (a, b). ADSCs on d 30 after induction with β-ME and NIM without AZC showed NSE and NF-L positivity. They resultant cells are not spheroids (c, d) (Magnification 20 x). Semi-quantitative gene expression profiling by RT-PCR of ADSC-derived neural-lineage cells at d 30 after induction (b). Neural – lineage cells obtained through the treatment of NIM without 5-azacytidine (NC WO AZC) and Neural – lineage cells obtained through the treatment of NIM with 5-azacytidine (NC with AZC). Untreated ADSCs used as control. The analysis shows reduced expression of neurofilaments.
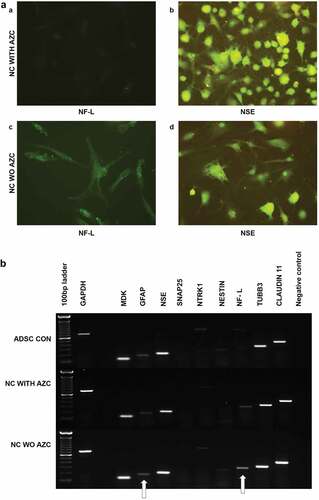
Figure 9. Immunocytochemical analysis of neuroprogenitor-like cells on d 30 after alternative treatment with bFGF and antioxidants showed NSE positivity in neuron-like cells. Cells exhibited a pyramidal neuron-like structure with a cone-shaped cell body (a). NF-L positivity in the filaments of neuron-like cells. NF-L was also present in growth cones, unlike progenitor cells; the filaments are long denoted by the white arrow (b). (Magnification20x).
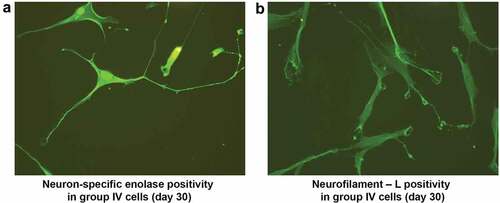
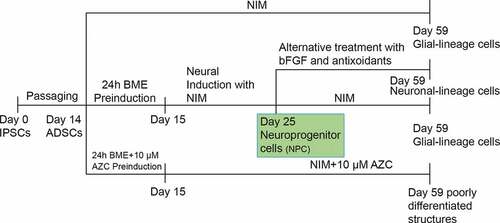
Figure 10. Schematic representation of protocols and the results were depicted.