Figures & data
Figure 1. Schematic overview of the study design. SGBS pre-adipocytes at time point T0 were differentiated for 14 d. Then, mature adipocytes were used to start a control group for normal feeding (4 d) and a test group for glucose restriction (4 d) and refeeding (4 d). GR: glucose restriction, RF: refeeding.
Figure 2. Recording of mature SGBS adipocytes during the experiment. a: mature adipocytes at time point T14, b: adipocytes at T18, c: adipocytes at T18GR, d: adipocytes at T22RF. a, b, c, d are all shown at 400 × magnification by the microscope camera system. GR: glucose restriction, RF: refeeding.
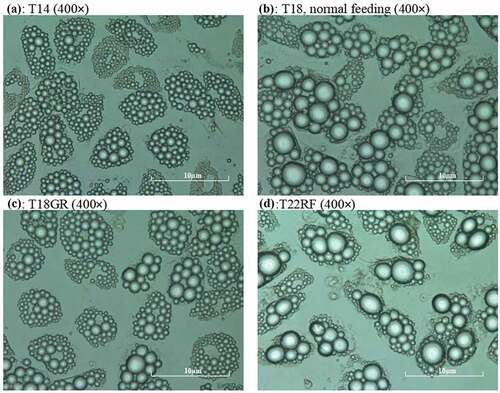
Figure 3. Diameter of fat droplets for the different experimental stages from T14 onwards.
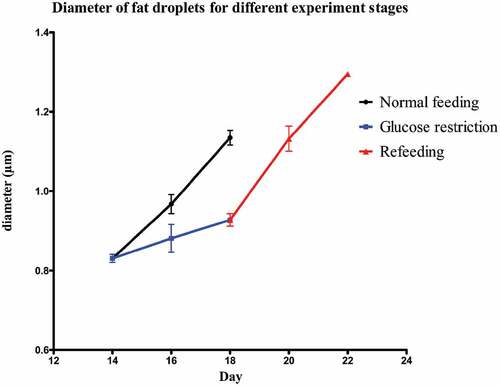
Figure 4. In-vitro proteomic changes in adipocytes at different time period. (a): Proteins significantly changed during GR. (b): Proteins significantly changed during RF after GR versus feeding. Dependent T-test was used for normal distributed variables, otherwise Wilcoxon test was used. P < 0.05 was considered significantly different. GR: glucose restriction, RF: refeeding.
Table 1. Correlations of RNA and protein changes with weight regain percentage.
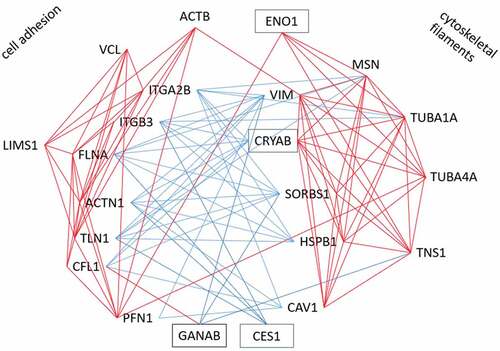
Figure 5. Cluster of significant correlations of CES1, CRYAB, ENO1 and GANAB with adhesome proteins in Yoyo study. Red line indicates significant positive correlation; blue line indicates significant negative correlation.