
Figures & data
Figure 5. Schematic representation of the changes in the number and cross-section area of fat clumps and of adipocyte number in the proximal, medial and distal SSP muscle after a complete SSP tendon detachment. IMF increased closer to the tendon tear compared to the proximal SSP muscle. Detached muscles had more clumps in the distal and medial sections and of larger size in the distal section. There were more adipocytes in the distal and medial detached SSP muscles compared to proximal and cross-sectional area was smaller in the distal SSP muscle. The fat clumps are represented by ovals and adipocytes by smaller filed black shapes. Results from the statistical analysis are indicated: 0.001 ≤ P < 0.01 (*), 0.0005 ≤ P < 0.001 (**), P < 0.0005 (***).
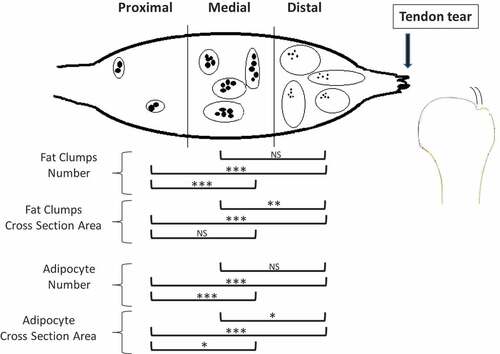
Table 1. Summary of the samples studied including numbers of rabbits, shoulders, and tissue sections for both fat clump and adipocyte analyses.
Figure 1. Representative micrographs of IMF accumulation in the distal quarter of the SSP muscle cross-sections. (a). SSP muscle sections at 4, 8 and 12 weeks after tendon detachment. (b). SSP muscle sections in control animals at the same time points. IMF was stained using osmium tetroxide and is visible at black-stained areas. Note the higher accumulation of fat in the tendon detached group compared to controls at all time points studied. Original magnification at 6.7x.
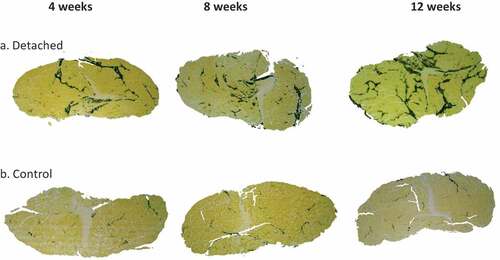
Figure 2. Representative micrographs of adipocytes in the proximal, middle and distal quarters of the SSP muscle. (a). SSP muscle sections at 12 weeks after tendon detachment. (b). SSP muscle sections from control age-matched animals. Adipocyte vacuoles stained black using the osmium tetroxide protocol described in the Method section. Note the increased number of smaller adipocytes in the tendon detached group compared to controls. Original magnification at 25x.
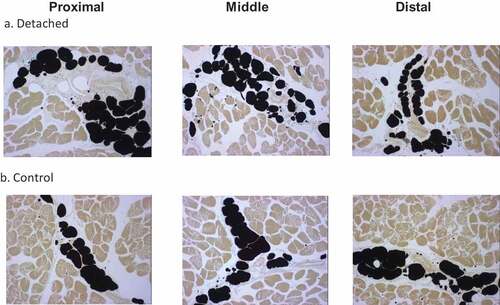
Figure 3. Boxplots showing the distribution of intramuscular fat clump numbers (a) and cross-sectional area (b) (mm2) for SSP tendons detached for 4, 8 and 12 weeks and for age-matched controls. Horizontal lines in the boxes represent the median values, limits of the boxes represent upper and lower quartiles, lines extending vertically from boxes represent variability outside the boxes and outliers are plotted as individual points. The dispersion of the number of fat clumps was similar for both detached and controls. A large variability in the fat clump cross-sectional areas was observed for the detached group in the distal quarter at 8 and 12 weeks after detachment and displayed in the large sizes of the boxes for these two groups compared to controls.
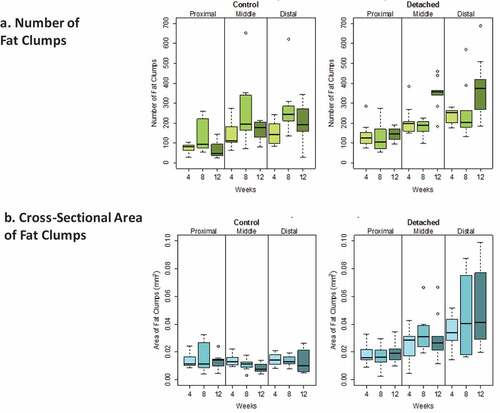
Figure 4. Boxplots showing the distribution of intramuscular adipocyte numbers (a) and cross-sectional area (b) (mm2) for SSP tendons detached for 4, 8 and 12 weeks and for age-matched controls. Horizontal lines in the boxes represent the median values, limits of the boxes represent upper and lower quartiles, lines extending vertically from boxes represent variability outside the boxes and outliers are plotted as individual points. The dispersion in the number of adipocytes was larger in the middle and distal quarters of the SSP muscle in the detached group compared to controls. The dispersion in adipocyte cross-section area was comparable in both groups.
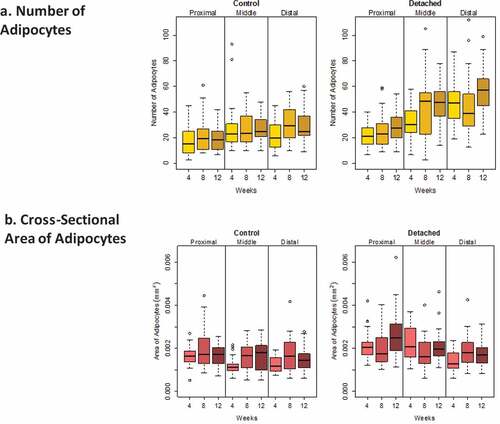
Table 2. Summary of ANOVA and of the post hoc linear mixed-effects model for the fat clump number and cross-section area. 0.001 ≤ P < 0.01 (*), 0.0005 ≤ P < 0.001 (**), P < 0.0005 (***).
Table 3. Summary of ANOVA and of the post hoc linear mixed-effects model of adipocyte number and cross-section area. 0.001 ≤ P < 0.01 (*), 0.0005 ≤ P < 0.001 (**), P < 0.0005 (***).