
Figures & data
Figure 1. Effect of butein A (panels 1) or HYAL (panel 2) on differentiation of 3T3-L1 preadipocytes into mature adipocytes. Expression of Adamts5 (panels a) and of the differentiation markers Ap2 (panels c), Pparγ (panels d) and Pref-1 (panels e) is shown as a function of time. Data are means ± SEM. Panels b represent Oil red O staining of differentiated 3T3-L1 preadipocytes (day 10) in the presence of butein, solvent DMSO or blank (panel b1) or in the presence of HYAL, solvent H2O or blank (panel b2). The scale bars correspond to 50 μm (magnification x100). Abbreviations: a disintegrin and metalloproteinase with thrombospondin motifs 5 (Adamts5), hyaluronic acid (HYAL), adipocyte protein 2 (Ap2), peroxisome proliferator-activated receptor γ (Pparγ), preadipocyte factor 1 (Pref-1) and dimethylsulfoxide (DMSO).
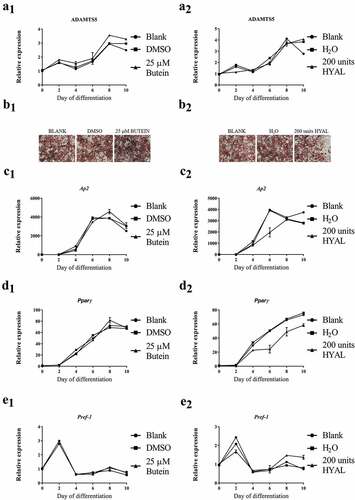
Figure 2. Effect of butein T on differentiation of 3T3-F442A preadipocytes into mature adipocytes. Expression of Adamts5 (a) and of the differentiation markers Ap2 (c), Pparγ (d) and Pref-1 (e) is shown at the start and at day 10 of differentiation. Data are means ± SEM of 5 determinations in 2 independent experiments and are normalized to the blank value at day 0. Panel b shows Oil red O staining of differentiated 3T3-F442A preadipocytes (day 10) in the presence of butein (25 μM) or DMSO. The scale bars correspond to 50 μm (magnification x100). Abbreviations: a disintegrin and metalloproteinase with thrombospondin motifs 5 (Adamts5), adipocyte protein 2 (Ap2), peroxisome proliferator-activated receptor γ (Pparγ), preadipocyte factor 1 (Pref-1) and dimethylsulfoxide (DMSO).
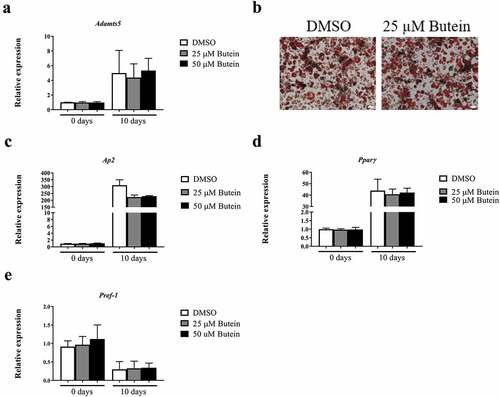
Figure 3. Effect of butein T on early phase differentiation of 3T3-F442A preadipocytes. The time course (0 – 24 h) of mRNA expression is shown for Adamts5 (a), and for the differentiation markers Ap2 (b), Pparγ (c) and Pref-1 (d). Data are means ± SEM. Abbreviations: a disintegrin and metalloproteinase with thrombospondin motifs 5 (Adamts5), adipocyte protein 2 (Ap2), peroxisome proliferator-activated receptor γ (Pparγ), preadipocyte factor 1 (Pref-1) and dimethylsulphoxide (DMSO).
Figure 4. Effect of butein T on the triglyceride content of 3T3-F442A preadipocytes at day 10 of differentiation seeded at a lower passage. 3T3-F442A preadipocytes were differentiated in the presence of 50 μM butein or the vehicle DMSO starting at two different time points: day −2 (time of seeding the cells; butein-2 or B-2 versus DMSO-2 or D-2) or day 0 (time of confluency; butein or B0 versus DMSO or D0). Furthermore, 3T3-F442A preadipocytes were differentiated with (Blank or Bl+) or without the addition of induction and differentiation medium (Blank Not. dif. or Bl-). (a) Oil Red O staining. The scale bars correspond to 100 μm (magnification x100). (b) Quantification of Oil Red O staining. Data are means ± SEM of 3–4 measurements. * p < 0.05 versus Blank cells according to the Mann-Whitney U test.
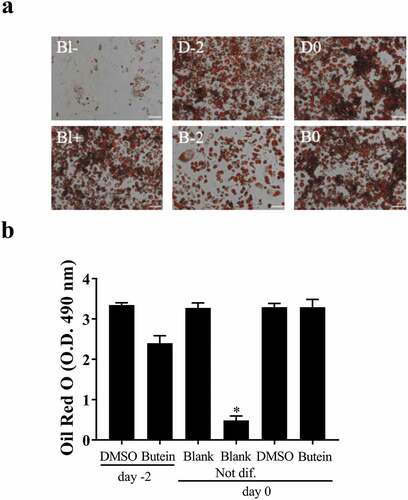
Figure 5. Effect of butein T on the differentiation of 3T3-F442A preadipocytes at a lower passage. 3T3-F442A preadipocytes were differentiated in the presence of 50 μM butein or the vehicle DMSO starting at two different time points: day −2 (time of seeding the cells; butein-2 versus DMSO-2; panels right) or day 0 (time of confluency; butein versus DMSO; panels left). Furthermore, 3T3-F442A preadipocytes were differentiated with (Blank) or without the addition of induction and differentiation medium (Blank not. dif.; panels left). (a–j) Gene expression analysis at day 10 of differentiation of the adipogenic markers Ap2 (a–b), Pref-1 (c–d), and Pparγ (e–f), and of Adamts5 (g–h), and Ucp-1 (i–j). Data are means ± SEM of 2–6 measurements. * p < 0.05 versus Blank cells; † p < 0.05 versus DMSO-2-treated cells and ‡ p < 0.05 versus DMSO-treated cells according to a two-way ANOVA with Bonferoni multiple comparison correction. Abbreviations: dimethylsulfoxide (DMSO); peroxisome proliferator-activated receptor γ (Pparγ); adipocyte protein 2 (aP2); preadipocyte factor-1 (Pref-1); a disintegrin and metalloproteinase with thrombospondin type 1 motifs, member 4/5 (Adamts4/5) and uncoupling protein-1 (Ucp-1).
Figure 6. Effect of butein T on ADAMTS5 expression in the ThermoMouse. Body weight (a) and adipose tissue mass (b) (subcutaneous, SC; gonadal, GON; brown adipose tissue, BAT) are shown after 4 days treatment with butein (10 or 20 mg/kg) or vehicle. Expression of Adamts5 (c) and Ucp-1 (d) is shown in fat tissues isolated after 4 days. Data were obtained as cycle thresholds. For each animal and tissue, two duplicates of cDNA were applied and the results were averaged. Data were subsequently normalized to the housekeeping gene and to the calibrator vehicle-treated animals for each tissue. Bioluminescence analysis is shown at days 1 and 4 for SC fat (e) and BAT (f). Data are means ± SEM of 2 (vehicle) – 4 (butein both doses) experiments. Abbreviations: a disintegrin and metalloproteinase with thrombospondin motifs 5 (Adamts5) and uncoupling protein 1 (Ucp-1).
Figure 7. Effect of butein T on the mean adipocyte size and adipocyte distribution in the ThermoMouse. The mean adipocyte size (a) of subcutaneous (SC) and gonadal (GON) adipose tissues is shown after 4 days treatment with butein (10 or 20 mg/kg) or vehicle. (b) Paraffin sections of SC and GON adipose tissues obtained from these mice were stained with H&E to show individual adipocytes. Magnification: 200x. Scale bar: 20 μm. The distribution of individual adipocyte sizes is shown for SC (c) and GON (d) adipose tissues, respectively. Data are means ± SEM of n = 2 (vehicle) – 4 (butein both doses) experiments.
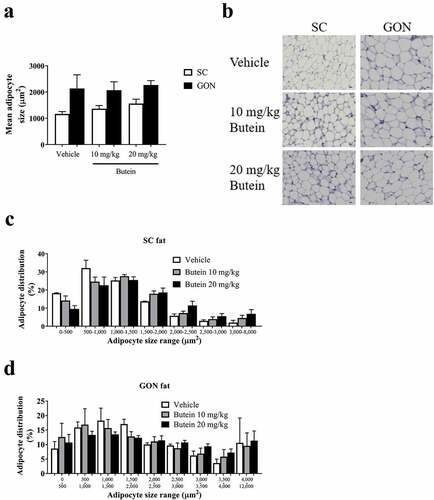
Figure 8. Effect of butein T on SC adipose tissue browning in the ThermoMouse. SC fat was obtained from ThermoMouse exposed for 4 days to butein (10 or 20 mg/kg; n = 4) or vehicle (n = 2). A BAT lysate of a ThermoMouse was used as a positive control for UCP-1 protein levels. Tissues were homogenized and protein lysates (50 µg for SC fat and 10 µg for BAT) were used in western blotting for PGC1-α (a) and UCP-1 (c). Panels (b) and (d) illustrate the densitometric quantitation of the PGC1-α and UCP-1 western blot, respectively, normalized for the levels of the loading control α-tubulin. Abbreviations: subcutaneous (SC); brown adipose tissue (BAT); peroxisome proliferator-activated receptor-γ coactivator 1-α (PGC1-α) and uncoupling protein-1 (UCP-1).
Table 1. Effect of butein T on body composition, food intake and fasting blood glucose levels in C57BL6/Rj mice exposed for 4 weeks to a methionine- and choline-deficient diet.