Figures & data
Figure 1. Steatosis in RBL2H3 induced by Insulin. (a–c). RBL2H3 control (a) or 6 day insulin-stimulated (b, c) stained with either LipidTox Green (488nm, A, B) or Oil Red O (c) and imaged using confocal microscopy. Scale bar is 10 microns. (d). Upper panel. Mean discrete lipid bodies per cell counted using thresholded Region of Interest (ROI) analysis (Nikon NIS Elements) across 100 control and 100 6 d insulin treated cells. Lower panel. Average LB diameter (in microns) measured for each LB. (e). Time course of lipid body formation in RBL2H3 in response to insulin treatment.
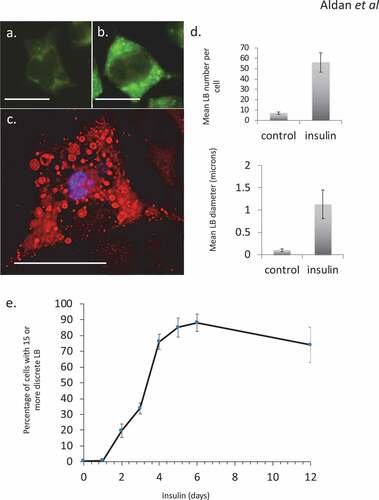
Figure 2. Whole cell lipidome of control and Lipid Body-rich RBL2H3. RBL2H3 were grown for 6d with insulin-FDI. Individual major lipid species were separated by high performance liquid chromatography (HPLC) and fatty acid methyl esters (FAME) from each class were produced and subsequently analyzed by GC/MS. A. Percentage changes in phospholipids, acylglycerols, and free fatty acids as constituents of mast cell lipid bodies. The change is a measure of insulin treated mast cell values minus control cell values divided by the control cell values and multiplied by 100 during the same experimental period. Each color represents a measured species: CE (cholesterol-fatty acid ester), DAG (diacylglycerol), FFA (free fatty acids), TAG (triacylglycerol), CL (cardiolipin), LYPC (lysophosphatidylcholine), PC (phosphatidylcholine), PE (phosphatidylethanolamine), PS (phosphatidylserine). The marker size and position correspond to the percentage change of that lipid, with larger markers and distance from the horizontal axis representing more significant differences between control and insulin-treated samples. B. Proportional representation (by percentage) of lipid classes in control and insulin (6d) treated RBL2H3. C, D. Insulin effects on lipid levels (nmol per billion cells) in the indicated classes. Data are presented on two graphs due to differences in y-axis scaling.
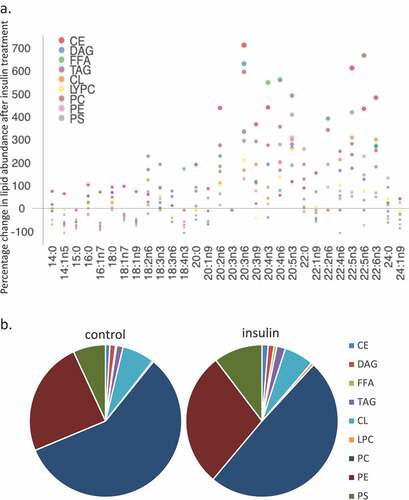
Figure 2. Continued.
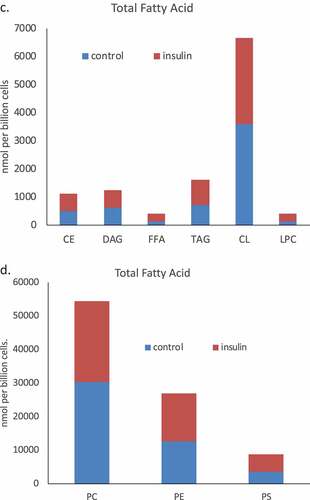
Figure 3. (a–d). Saturation analysis of lipids in RBL2H3 in the absence and presence of chronic insulin exposure. Lipid classes were analysed for the presence of Saturated Fatty Acids (SFA), Mono-unsaturated FA (MUFA), Poly-unsaturated FA (PUFA) and omega n 3, 6, 7, and 9 lipids. Data in A and C present absolute lipid levels (nmol per billion cells). Data in B and D show normalized data to assess proportional representation of SFA, MUFA, etc., in each class in the absence and presence of insulin. Aggregated lipid groups (e.g. PUFA) are shown alongside disaggregated categories (e.g. n3 alone, which is a subset of PUFA). E-M. Normalized (each to 100%) proportion of each lipid species by class in the absence and presence of chronic insulin exposure.
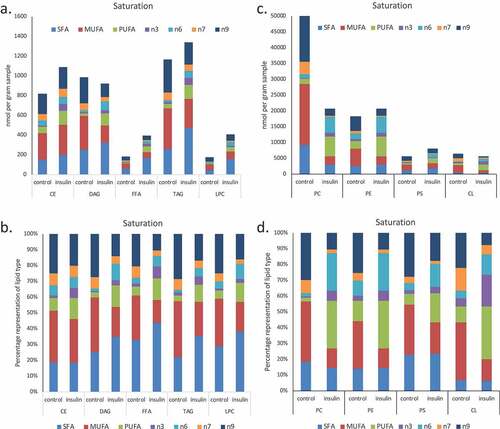
Figure 3. Continued.
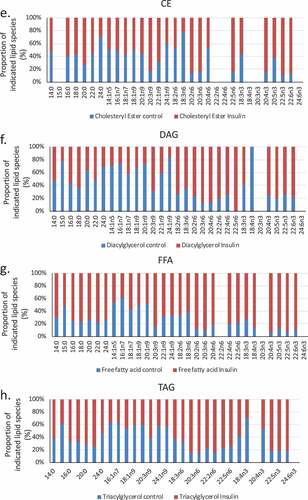
Figure 3. Continued.
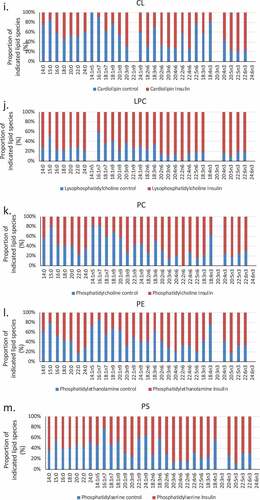
Figure 4. EPA, DHA, AA and Cardiolipin pools are remodelled during chronic insulin exposure in RBL2H3. (a). Pie chart overview of proportions (%) of lipids in each category. (b–d). Absolute levels (nmol per billion cells) of DHA, EPA, AA and CL species localized within specific cellular pools (esterified onto phospholipids (PL), in neutral lipid (NL) pools, as Free Fatty Acids (FFA) or as cardiolipins (CL). E. Normalized percentage abundance of each lipid species by pool in the absence and presence of chronic insulin exposure.
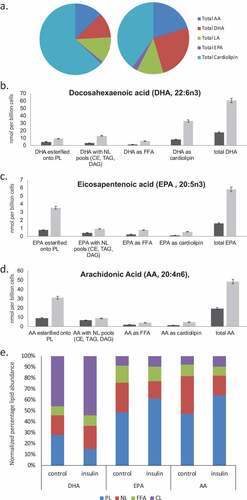
Figure 5. Assessment of histamine and bioactive lipid release by RBL2H3 in the absence and presence of chronic insulin. (a). Summary data for histamine, LTC4, PGD2, Resolvin D1 and E1 release by RBL2H3 in response to FcεRI stimulation (IgE anti-DNP followed by 200 ng/ml KLH-DNP) after 6 d treatment with either vehicle or insulin (10 μg/ml). (b). Western blots of lysates prepared from control and 6d insulin cells and probed with antibodies to either 5-lipoxygenase or 15-lipoxygenase, as indicated. AU, arbitrary intensity units from densitometry. (c). Dose response of Resolvin D1 and E1 abundance in RBL2H3 following 6 d treatment with the indicated levels of insulin. Resolvin D1: p values relative to control for insulin doses: 1ng/ml Ins p > 0.05, 10 ng-10,000ng/ml Ins, p < 0.005. Resolvin E1. 1ng/ml Ins p > 0.05, 10 ng-10,000ng/ml Ins, p < 0.005.
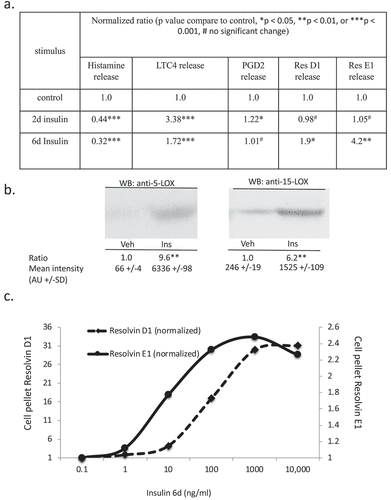
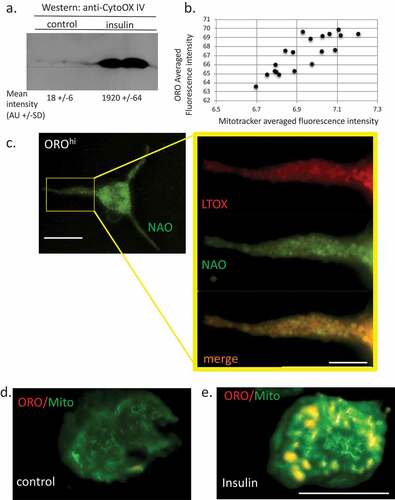
Figure 6. Relationship between lipid bodies, mitochondria and cardiolipins in insulin-treated RBL2H3. (a). Western blot analysis of Cytochrome oxidase IV levels in control and 6 d insulin-treated RBL2H3. AU, arbitrary intensity units from densitometry. (b). Correlation between Mitotracker and ORO staining intensities. Scale bar at left is 10 microns, scale bar at right is 2.5 microns. (c). Co-localization of ORO and NAO staining in RBL2H3 treated for 6d with insulin. (d, e). Matched confocal imaging (all parameters equivalent) of the cell bodies of 2 RBL2H3, control (d) or insulin treated for 6 d (e) stained as indicated with ORO and MitoTracker Green. Scale bars are 10 microns.