Figures & data
Table 1. Time-dependent changes of mesenchymal stem cell (MSC) markers, adipocyte differentiation-related factors, vascular adipocyte number, and abdominal aortic aneurysm (AAA) formation.
Figure 1. Time-dependent changes of the dilation ratio of the abdominal aorta and the number of adipocytes in the vascular wall. (a–i) Representative images of the abdominal aorta on days 0, 2, 3, 5, 7, 14, 21, and 28 after the induction of hypoperfusion (scale bar = 1.5 mm). (j–r) Representative images of the hematoxylin-eosin (HE) staining (scale bar = 200 µm). (s) Dilation ratio of the abdominal aorta and the number of adipocytes in the vascular wall. (t) Thickness of the vascular wall. Data are expressed as the mean ± SEM. *P < 0.05 versus day 0. Day 0 (n = 5), day 2 (n = 5), day 3 (n = 5), day 5 (n = 5), day 7 (n = 5), day 10 (n = 6), day 14 (n = 5), day 21 (n = 5) and day 28 (n = 7).
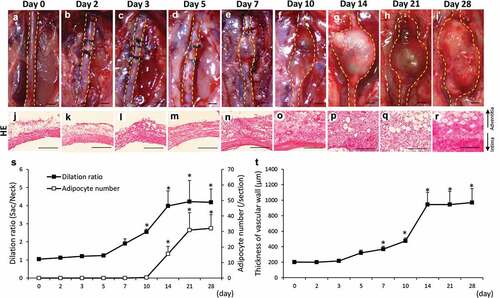
Figure 2. Co-localization of HIF-1α, CD44, and CD90 in the vascular wall. (a) Representative image of the AAA-neck wall with perivascular adipose tissue (PVAT). The squared area is representative area for analysis. Double-immunostaining for CD44 and CD90 (b–e), HIF-1α and CD44 (f–i), and HIF-1α and CD90 (j–m) in the abdominal aortic aneurysm (AAA)-neck wall. (n) Representative image of the AAA-sac wall with PVAT. The squared area is representative area for analysis. Double-immunostaining for CD44 and CD90 (o–r), HIF-1α and CD44 (s–v), and HIF-1α and CD90 (w–z) in the AAA-sac wall. Scale bar = 50 µm. Neck (n = 5) and sac (n = 5) walls.
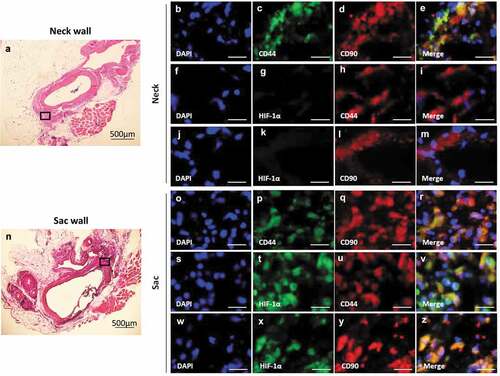
Figure 3. Localization of PPARγ2, MKL1, and mesenchymal stem cell (MSC) markers in the vascular wall. Double-immunostaining for CD44 and PPARγ2 (a–d), MKL1 and CD90 (e–h), and DAPI and MKL1 (i–k) in the abdominal aortic aneurysm (AAA)-neck wall. Double-immunostaining for CD44 and PPARγ2 (l–o), MKL1 and CD90 (p–s), and DAPI and MKL1 (t–v) in the AAA-sac wall. The squared area in the (v) panel is magnified in the (w) panel. The white and green arrows indicate the extranuclear and intranuclear regions, respectively. Scale bar = 50 µm. Neck (n = 5) and sac (n = 5) walls.
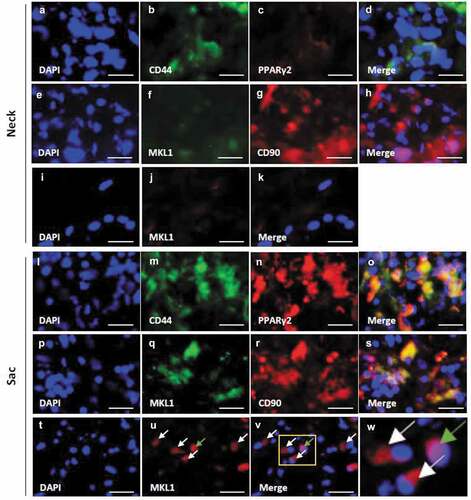
Figure 4. Effects of the perivascular adipose tissue (PVAT) removal on the number of adipocytes and the areas positive for CD44, CD90 and Mac387 in the vascular wall. Representative images of hematoxylin-eosin (HE) staining (a–c) and the number of adipocytes (d). Representative images of the immunostaining for CD44 (e–g) and quantification of CD44 positive areas (h). Representative images of the immunostaining for CD90 (i–k) and quantification of the CD90 positive areas (l). Representative images of the immunostaining for Mac387 monocytes/macrophages (m–o) and quantification of Mac387 positive areas (p). (scale bar = 100 µm) Vascular wall without the induction of hypoperfusion (day 0) (n = 6), vascular wall with the induction of hypoperfusion (day 21) (n = 8) and PVAT-removed vascular wall with the induction of hypoperfusion (day 21) (n = 6). (q, r) Representative images of HE staining of PVAT on days 0 and 21 after the induction of hypoperfusion. Representative images of the immunostaining for CD44 (s, t) and CD90 (u, v). (scale bar = 50 µm) Quantification of areas positive for CD44 (w) and CD90 (x). Day 0 (n = 4) and day 21 (n = 3).
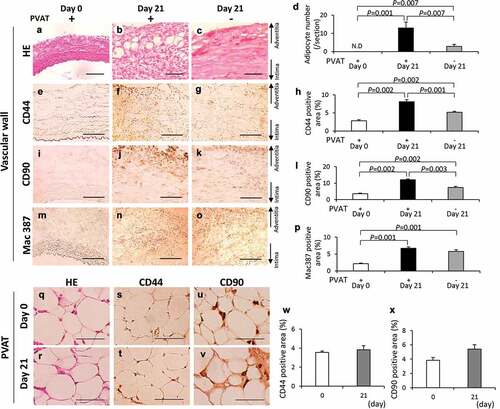
Figure 5. Effect of PVAT removal on the development of AAA. (a) The incidence ratio of AAA (b) The effect of the removal of PVAT on AAA rupture ratio. (c) Representative images of the abdominal aorta on day 21 after the induction of hypoperfusion, and day 21 after the induction of hypoperfusion with the removal of PVAT (scale bar = 1.5 mm). (d) Dilation ratio of the aortic wall. (e-h) Representative images of picrosirius red (PSR) staining (scale bar = 50 µm). (i) Quantification of collagen positive area. The vascular wall with the induction of hypoperfusion (day 21) (n = 19), and PVAT-removed vascular wall with induction of hypoperfusion (day 21) (n = 14).
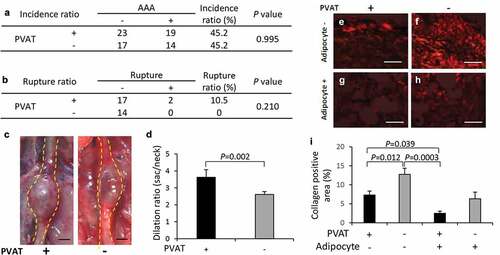
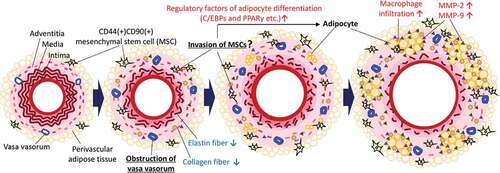
Figure 6. Putative potential mechanism underlying the ectopic appearance of adipocytes in the AAA wall. Hypoperfusion in the aortic wall due to the obstruction of the vasa vasorum resulted in the appearance of CD44+CD90+ MSCs in the aortic wall. The increased CD44+CD90+ MSCs differentiated into abnormal adipocytes in the vascular wall with the expression of adipocyte differentiation regulatory factors. The appearance of adipocytes can cause a weakness of the vascular wall. It should be noted that this schema is a simplified focused on the adipocytes in the vascular wall. In the actual AAA wall, various pathological events, not only adipocytes accumulation, but also extracellular matrix degradation, microcalcification, and oxidative stress in the media, are involved in the development of AAA. Further studies are needed to elucidate the relationship between adipocyte infiltration and other AAA events.