
Figures & data
Table 1. Comparative assessment of adipogenic media supplementation for the in vitro differentiation of adipose-derived stem cells (ASC). Reference for standard differentiation media established in our laboratory is underlined.
Table 2. Phenotypic characterization of isolated human adipose-derived stem cells (hASC) at passage 0. Columns show manufacturers with catalogue numbers of used antibodies, donors (1–6) and mean ± SEM. Data are presented as percentage of positive cells for the particular surface marker measured by flow cytometry of 5000 cells.
Table 3. Supplementation of glucose, insulin and mannitol used in cell culture media with reference to the standard differentiation medium for the adipogenic differentiation of human adipose-derived stem cells (hASC).
Figure 1. Schematic timeline of the adipogenic differentiation protocol. Human adipose-derived stem cells (hASC) were grown to confluence (defined as day 0) and differentiated in standard media (DM) or with glucose and insulin for a period of 28 days. Cells cultured in growth media (GM) for equal time served as an undifferentiated control and D-Mannitol was consistently used as an osmotic control for glucose treated cells.
Table 4. List of reference (RPL37, RPS12) and target (LPL, PPARγ) genes used for qRT-PCR. Forward (F) and reverse (R) sequences of primer pairs and expected amplicon length in base pairs (bp).
Figure 2. Fluorescence microscopic visualization of live/dead assay after 28 days of adipogenic differentiation of human adipose-derived stem cells. Vital cells with numerous large lipid vacuoles stained green, dead cells stained read. Overlay at 20x magnification, scale bar: 50 µm. (a) undifferentiated control (GM); (b) standard differentiation media (DM); (c) fourfold glucose concentration (4G); (d) fourfold insulin concentration (4I).
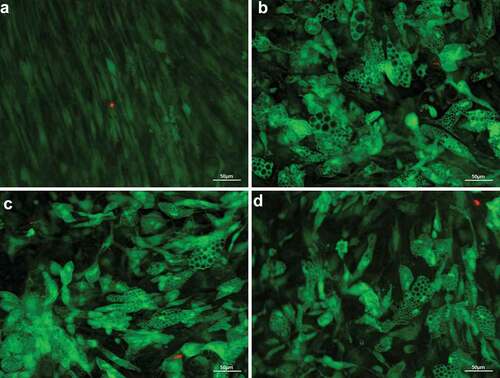
Figure 3. Accumulation of lipid droplets over the time of adipogenic differentiation in DM visualized by light microscopy (20x magnification, scale bar: 100 µm). (a) undifferentiated adipose-derived stem cells (hASC) 7 days after isolation; (b–e) 7, 14, 21 and 28 days after differentiation was induced; (f) Oil-Red-O stained cells, 28 days after differentiation was induced.
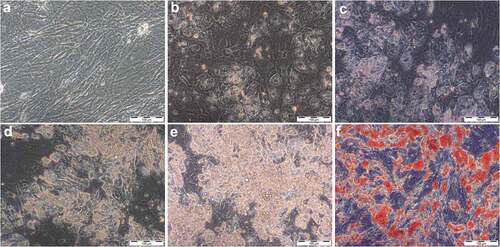
Figure 4. Histological stain after 28 days of differentiation in supplemented adipogenic media. Cultures with fourfold glucose (4G: a, b) and fourfold insulin (4I: c, d) concentrations at 20x (a, c; scale bar: 100 µm) and 40x magnification (b, d; scale bar: 50 µm). Standard differentiation (e) and mannitol treatment as an osmotic control for 4G (f) are presented at 20x magnification. Lipid-containing vacuoles were visualized by Oil-Red-O staining (red), cell nuclei were stained by haematoxylin (blue). Compared to high insulin treated cells, Oil-Red-O stained area was significant higher in fourfold glucose conditions with larger lipid droplets (b) which is characteristic for mature adipocytes.
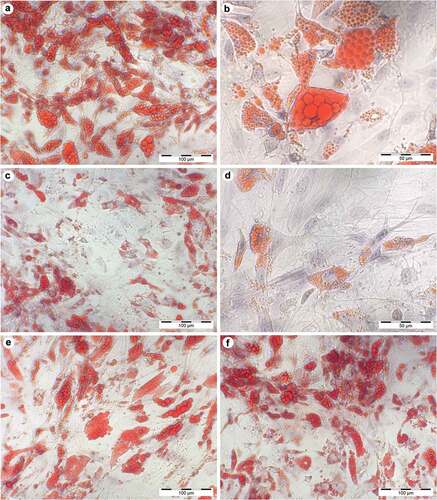
Figure 5. Relative differences in lipid accumulation after 28 days of adipogenic differentiation compared to standard media (DM). Oil-Red-O stained area was quantified in 10 randomly selected microscopic fields by the java-based image processing program ImageJ. Values are presented as mean ± SEM, students t-test was used for statistical analysis; *p < 0.05 and **p < 0.01 for significant results compared to DM. (a) Glucose increases lipid levels, however not significantly (DM: standard differentiation media; 2G, 4G: twofold and fourfold glucose concentration). (b) Insulin significantly reduces lipid accumulation (DM: standard differentiation media; 2I, 4I: twofold and fourfold insulin concentration) (c) which can be partially rescued by glucose (DM: standard differentiation media; 2GI, 4GI: twofold and fourfold glucose and insulin concentration; 2MI, 4MI: mannitol control for combined treatment).
Figure 6. Fold change of PPARγ (a) and LPL (b) gene expression, 28 days after adipogenic differentiation induction, analysed by qRT-PCR. ΔΔCT method was used for relative quantification with RPL37 and RPS12 as reference genes compared to gene expression in standard differentiation media (DM). Mean values are expressed in relative units ± SEM. Statistical comparison between groups was performed with students t-test; *p < 0.05.
Figure 7. Metabolite turnover, analysed in conditioned media over the period of 4 weeks. Glucose uptake and lactate production in (a) human adipose-derived stem cells (hASC) cultured in growth media (GM) and (b) standard differentiation media (DM). Values are expressed as mean ± SEM, students t-test was used for statistical comparison between groups; *p < 0.05, **p < 0.01.
Data availability statement
The authors confirm that the data supporting the findings of this study are available within the article.