Figures & data
Figure 1. Block to angiogenesis measured by tube formation in HUVECs. 20,000 (a) and 30,000 (b) cells were treated with 20 µM, 50 µM and 100 µM of BL6 and their respective tube length measured (c, d). Cells were cultured for 24 hours on Matrigel at 37°C and tube formation was determined following 24 hours. The effect of each dose of BL6 was compared to its own DMSO control. The experiment was repeated a minimum of three times.
Figure 2. Effect of BL6 on adipocyte differentiation (a) and corresponding Oil Red O staining (b) in cultured 3T3-L1 adipocytes. (a) 3T3-L1 pre-adipocyte cells were treated with 20 µM, 50 µM and 100 µM of BL6 along with MDI for 8 days during differentiation. Block to adipogenesis was visually observed following oil red O staining for lipid. (b) Lipid staining was quantified by measuring absorbance. Y-axis shows absorbance of Oil Red O dye at 510 ηm. Data are presented as average absorbance ± sd (n = 6). The effect of each dose of BL6 was compared to its own DMSO control. Groups sharing different alphabet denote statistical significance (P < 0.05). The experiment was repeated a minimum of three times.
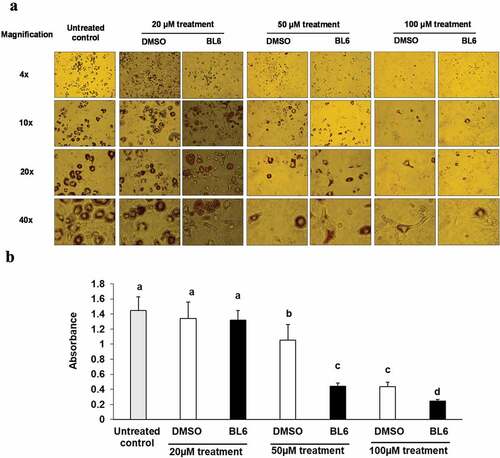
Figure 3. Gene expression of PPARγ, FASn, SREBP1, C/EBP β, adiponectin, C/EBP α, Glut4 and MetAP2 for 20 µM (a), 50 µM (b) and 100 µM (c) of BL6 treatment along with their respective DMSO control. Real time qRT-PCR was performed to determine the relative gene expression following BL6 treatment. The Y-axis shows fold-change difference in expression. The effect for each dose of BL6 was compared to its own DMSO control. Data are presented as average fold change ± sd (n = 3). Bars showing asterisks on top denote statistical significance (P < 0.05). The experiment was repeated a minimum of three times.
Figure 3. Continued
Figure 4. Protein expression of PPARγ, C/EBP α, FASn, adiponectin, pAKT and Glut4 for 20 µM, and 50 µM of BL6 treatment along with DMSO control. Protein lysates from 3T3-L1 cells treated with 20 µM BL6, and 50 µM BL6 during differentiation were separated on a SDS-PAGE gel, transferred onto a nitrocellulose membrane and immunoblotted with PPARγ, C/EBPα, FASn, adiponectin, pAKT, Glut4 and GAPDH antibodies. Graphs show average density of protein bands normalized to GAPDH and Akt. The effect of each dose of BL6 was compared to its own DMSO control. Data are presented as average ± sd (n = 3). Statistical significance was determined by Student TTEST (P < 0.05) and shown by asterisks on top of the bar.
Figure 4. Continued
Figure 4. Continued
Figure 5. Protein expression of PPARγ, C/EBP α, FASn, adiponectin, pAKT and Glut4 for 100 µM of BL6 treatment along with DMSO control. Protein lysates from 3T3-L1 cells treated with 100 µM BL6 during differentiation were separated on a SDS-PAGE gel, transferred onto a nitrocellulose membrane and immunoblotted with PPARγ, C/EBP α, FAS, adiponectin, pAKT, Glut4, β actin, α tubulin, and GAPDH antibodies. Graphs show average density of protein bands normalized to either GAPDH, β actin or α tubulin. The effect of 100µM BL6 on protein expression was compared to its own DMSO control. Data are presented as average ± sd (n = 3). Statistical significance was determined by Student TTEST (P < 0.05) and shown by asterisks on top of the bar. The experiment was repeated a minimum of three times.
Figure 5. Continued
Figure 5. Continued
Figure 6. Glucose uptake for 20 µM and 100 µM of BL6 treated adipocyte cells. 3T3-L1 pre-adipocyte cells were treated with 20 µM, and 100 µM of BL6 along with MDI for 8 days during differentiation. Glucose uptake assay was performed following differentiation. (a) Insulin independent glucose uptake was determined with 100µM BL6 treated cells. Y-axis represents glucose uptake in CPM/mg/mL. (b) Similarly the effect of insulin during block to adipogenesis when cells were treated with 20µM and 100 µM of BL6 was determined under insulin stimulated conditions. Basal group on the X-axis represents glucose uptake independent of insulin. Radioactive glucose uptake was normalized to total protein content. Data are presented as average ± sd (n = 6). Groups sharing different alphabet denotes statistical significance (P < 0.05) as determined by ANOVA. The experiment was repeated a minimum of three times.