
Figures & data
Table 1. 86 differentially expressed genes (DEGs) between the IRO and ISO subjects.
Figure 1. Heatmap of 86 DEGs screened by limma package in R software. Red areas represent highly expressed genes and green areas represent lowly expressed genes in omental adipose from IRO subjects compared with ISO subjects. DEG: differentially expressed gene; IRO: insulin-resistant obesity; ISO: insulin sensitivity obesity.
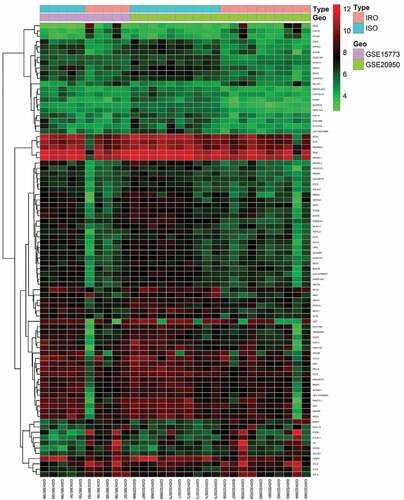
Figure 2. Volcano plot analysis identifies DEGs. Red dots represent 12 upregulated genes and green dots represent 64 downregulated genes in omental adipocyte from IRO subjects compared with ISO subjects.
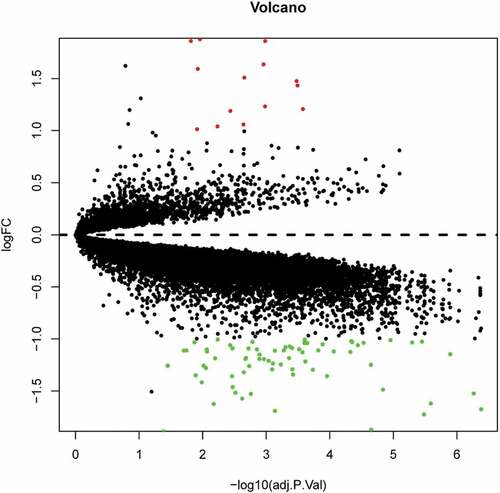
Figure 3. GSEA plot showing most enriched gene sets of all detected genes in the IRO subjects. The top-three most significant down-regulated enriched gene sets in the IRO subjects: kidney mesenchyme development (a), sex determination (b), positive regulation of synaspse assembly (c). The top-three most significant up-regulated enriched gene sets in the IRO subjects: leukocyte chemotaxis (d), chemokine-mediated signalling pathway (e), positive regulation of inflammatory response (f). GSEA: gene set enrichment analysis; NES: normalized enrichment score.
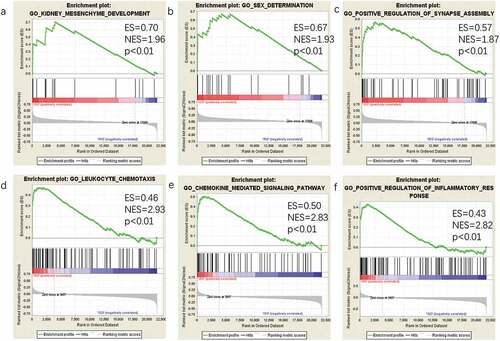
Figure 4. GO enrichment result of DEGs. The x-axis label represents gene ratio and y-axis label represents GO terms. The size of circle represents gene count. Different colour of circles represents different adjusted p value. DEG: differentially expressed gene; FDR: false discovery rate; GO: Gene Ontology.
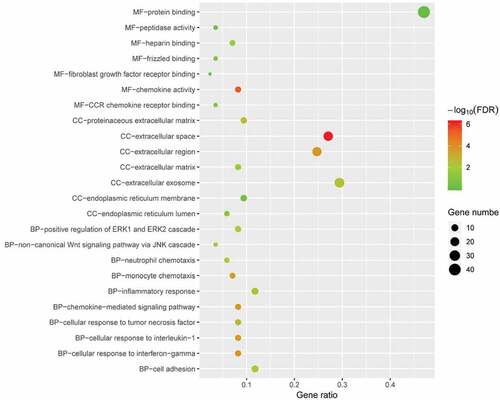
Figure 5. KEGG pathway analysis of differentially expressed genes. Advanced bubble chart shows enrichment of DEGs in signalling pathways. Y-axis label represents pathway, and X-axis label represents rich factor (rich factor = amount of DEGs enriched in the pathway/amount of all DEGs in background gene set). Size and colour of the bubble represent amount of DEGs enriched in pathway and enrichment significance, respectively. KEGG: Kyoto Encyclopedia of Genes and Genomes; DEG: differentially expressed gene; FDR: false discovery rate.
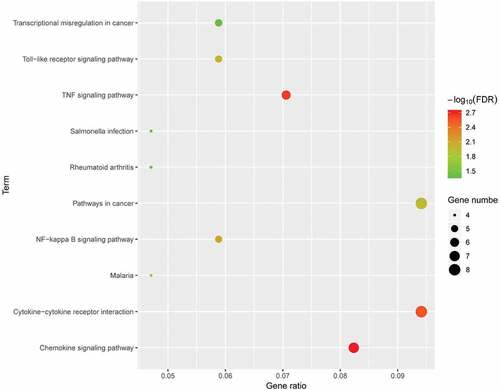
Figure 6. The PPI network and the most significant modules of DEGs. (a) The PPI network was analyzed by String software. Here were 47 nodes and 102 edged in the PPI network. (b) The most significant module identified by MCODE (score = 8.5). DEG: differentially expressed gene; PPI: protein–protein interaction.
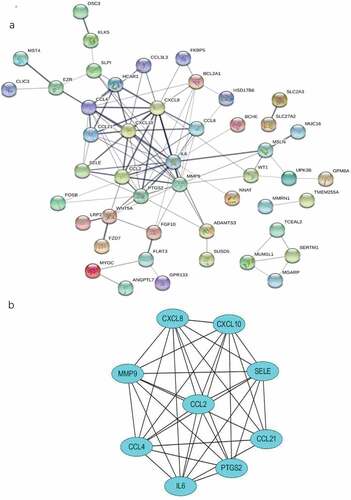
Table 2. 10 hub genes identified by Cytohubba.
Figure 7. The expression of genes significantly upregulated in the adipose of the 10-weeks obese diabetic mice. (a) CCL2 gene expression was significantly upregulated in the adipocyte of the 10-weeks obese diabetic mice (p < 0.001). (b) IL6 gene expression was significantly upregulated in the adipocyte of the 10-weeks obese diabetic mice (p < 0.05). (c) CCL4 gene expression was significantly upregulated in the adipocyte of the 10-weeks obese diabetic mice (p < 0.001).
Table 3. List of the 20 most significant small molecular compounds provided by CMap analysis to reverse altered expression of DEGs in cell lines.