1,451
Views
7
CrossRef citations to date
0
Altmetric
Brief Report

Visceral adipose tissue alteration of PI3KR1 expression is associated with gestational diabetes but not promoter DNA methylation

ORCID Icon, ORCID Icon, ORCID Icon, , , & ORCID Icon show all
Pages 339-346 | Received 15 Aug 2019, Accepted 26 Sep 2019, Published online: 12 Oct 2019

Figures & data

Table 1. Maternal and birth characteristics of study cohort according to groups (NGT and GDM).

Figure 1. Relative mRNA levels of IRS1, IRS2, PI3KCA and PI3KR1 in SAT (a) and VAT (b) of women with GDM vs. NGT. Relative gene expression of insulin receptor substrate 1 and 2 (IRS1, IRS2), phosphoinositide-3-kinase alpha (PI3KCA) and phosphoinositide-3-kinase regulatory subunit p85 (PI3KR1) was normalized to peptidylprolyl isomerase A (PPIA) in abdominal subcutaneous (SAT- a) and visceral omental adipose tissues (VAT – b), of women with gestational diabetes mellitus (GDM; black; n = 20) vs. normal glucose tolerant women (NGT; white; n = 22). Sum expression values of IRS1 + 2 and PI3KCA+R1 were also included. Data are means ± SEM, shown as percentage to NGT levels. A.U., arbitrary units.* P< 0.05 (Mann-Whitney-U test). PI3KR1-VAT P = 0.012, Sum PI3KCA+R1-VAT P = 0.014.
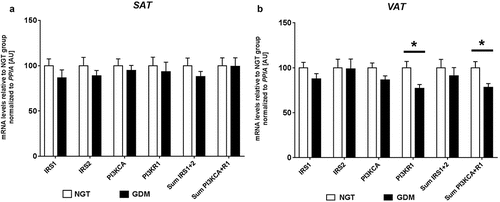
Figure 1. Relative mRNA levels of IRS1, IRS2, PI3KCA and PI3KR1 in SAT (a) and VAT (b) of women with GDM vs. NGT. Relative gene expression of insulin receptor substrate 1 and 2 (IRS1, IRS2), phosphoinositide-3-kinase alpha (PI3KCA) and phosphoinositide-3-kinase regulatory subunit p85 (PI3KR1) was normalized to peptidylprolyl isomerase A (PPIA) in abdominal subcutaneous (SAT- a) and visceral omental adipose tissues (VAT – b), of women with gestational diabetes mellitus (GDM; black; n = 20) vs. normal glucose tolerant women (NGT; white; n = 22). Sum expression values of IRS1 + 2 and PI3KCA+R1 were also included. Data are means ± SEM, shown as percentage to NGT levels. A.U., arbitrary units.* P< 0.05 (Mann-Whitney-U test). PI3KR1-VAT P = 0.012, Sum PI3KCA+R1-VAT P = 0.014.

Figure 2. DNA Methylation analysis in the PI3KR1 promoter region. CpG site-specific DNA methylation analyses at the phosphoinositide-3-kinase regulatory subunit p85 (PI3KR1) at the CpG island within the promoter region in the visceral omental adipose tissue from mothers with NGT vs. GDM. Schematic illustration of the DNA methylation assay for the PI3KR1 promoter region, including a characterized transcription factor binding site for PPARgamma (a). Percent DNA methylation at each individual CpG site investigated (12 CpG sites) in the VAT for normal glucose tolerant (NGT; white; n = 22) vs. gestational diabetes mellitus group (GDM; black; n = 20). (b) CpG site number is location distance from transcriptional start site (TSS). Overall mean across CpG sites is also included. Data are means ± SEM.
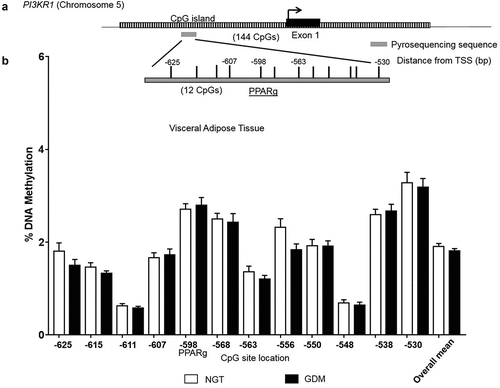
Figure 2. DNA Methylation analysis in the PI3KR1 promoter region. CpG site-specific DNA methylation analyses at the phosphoinositide-3-kinase regulatory subunit p85 (PI3KR1) at the CpG island within the promoter region in the visceral omental adipose tissue from mothers with NGT vs. GDM. Schematic illustration of the DNA methylation assay for the PI3KR1 promoter region, including a characterized transcription factor binding site for PPARgamma (a). Percent DNA methylation at each individual CpG site investigated (12 CpG sites) in the VAT for normal glucose tolerant (NGT; white; n = 22) vs. gestational diabetes mellitus group (GDM; black; n = 20). (b) CpG site number is location distance from transcriptional start site (TSS). Overall mean across CpG sites is also included. Data are means ± SEM.

Table 2. Summary of PI3KR1 (p85) molecular findings in studies involving metabolic health e.g. GDM and adiposity.