Figures & data
Table 1. Gene expression RNA-Seq datasets. GEO, gene expression omnibus; PMID, PubMed ID; N, number of samples; Stage, stage of differentiation (0, non-induced, 1, early; 2, intermediate; 3, late-differentiation); Ref., reference; NA, missing.
Table 2. DNA-binding ChIP-Seq datasets. SRA, sequence read archive; PMID, PubMed ID; N, number of samples; Stage, stage of differentiation (0, non-induced, 1, early; 2, intermediate; 3, late-differentiation); Factor, protein antibody; Ref., reference; NA, missing.
Figure 1. RNA-Seq and ChIP-Seq data processing pipelines. Raw reads were obtained from SRA using Wget. Reads quality was assessed using FASTQC. The mouse genome sequence and annotation were downloaded from UCSC. The genome indices were generated and used to align the RNA and ChIP-Seq reads using HISAT2 and BOWTIE2, respectively. The aligned RNA-Seq reads were used to count reads in genes using featureCounts. The aligned ChIP-Seq reads were used to call and annotate peaks using MACS2 and ChIPSeeker. Reads in peaks were counted using BEDTOOLS.
Figure 2. Multidimensional scaling analysis of the gene expression and adipogenic transcription factor binding in differentiating adipocytes. (a) Reads count in genes from RNA-Seq samples (n = 98) were transformed using variance stabilization transformation (VST) and used as an input to multidimensional scaling (MDS). The first two dimensions are shown. Numbers represent the differentiation stage of the samples (0, non-induced; 1, early; 2, intermediate; 3, late-differentiation). (b) Reads count in peaks of a subset of ChIP-Seq samples (n = 22) were transformed using VST and used as an input in MDS. The first two dimensions are shown. Numbers represent the antibody used in each sample (1, CEBPB; 2, PPARG). Colours represent the origin study of the sample.
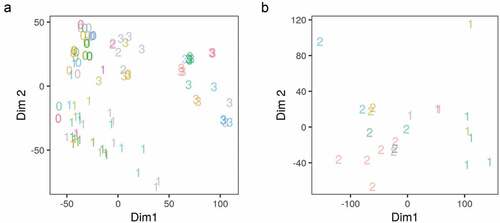
Figure 3. Samples and replicates similarity. (a) Reads count in genes from RNA-Seq samples (n = 98) were transformed using variance stabilization transformation (VST) and used to calculate Euclidean distances between all pairs of samples (blue, low; red, high). Samples are labelled by their time (hours) and the differentiation stage (0, non-induced; 1, early; 2, intermediate; 3, late-differentiation). (b) Reads count in peaks from ChIP-Seq samples (n = 18) were transformed using VST and used to calculate Euclidean distances between all pairs of samples (blue, low; red, high). Samples are labelled by their time (hours) and the antibody used in the sample (CEBPB or PPARG).
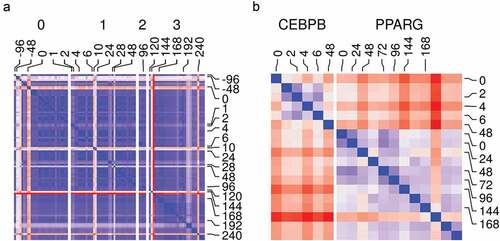
Figure 4. Gene expression and binding patterns of adipogenic transcription factor and lipogenic genes. (a) Reads count in adipogenic (Cebpa, Cebpb and Pparg) and lipogenic (Acyl, Fasn and Lpl) genes from RNA-Seq samples (n = 98) were transformed using variance stabilization transformation (VST), scaled and shown as colour values (blue, low; red, high). Samples are labelled by their time (hours) and the differentiation stage (0, non-induced; 1, early; 2, intermediate; 3, late-differentiation). (b) Reads count in peaks of lipogenic genes (same as above) from ChIP-Seq samples (n = 22) were transformed using VST, scaled and shown as colour (blue, low; red, high). Samples are labelled by their time (hours) and the antibody used in the sample (CEBPB or PPARG).
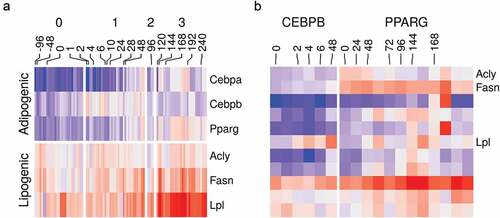
Figure 5. Gene ontology enrichment analysis of differentially expressed genes and differentially bound peaks. (a) Genes from RNA-Seq samples (n = 98) were tested for differential expression between stages (1, early; 2, intermediate; 3, late-differentiation) and 0, non-induced stage using the reads count. The deferentially expressed (DE) genes were used to perform gene set enrichment analysis. The fraction in each comparison of DE genes in the gene ontology (GO) terms: adipose tissue development (GO:0060612); lipid catabolic process (GO:0016042); lipid storage (GO:0019915); glucose metabolic process (GO:0006006); and cellular response to insulin stimulus (GO:0032869) are shown as bars. (*) indicates p-values . (b) Peaks in ChIP-Seq samples (n = 22) were tested for differential peak binding between stage (1, early-differentiated, for CEBPB; 3, late-differentiated, for PPARG) and 0 non-induced stage using the reads count in peaks. The absolute fold-changes of significantly expressed peaks in genes from the three GO terms (same as above) and a random gene set (n = 50) are shown as box plots (25%, 50% and 75% percentiles).
Figure 6. Histone modifications at the promoter region of fat cell differentiation regulators in adipocytes. Signal tracks from ChIP-Seq samples (n = 9) of histone markers were extracted from regions coding for the members of two gene ontology (GO) terms. The GO terms are negative regulation of fat cell differentiation (GO:0045599; n = 63) and positive regulation of fat cell differentiation (GO:0045600; n = 62). Scores at 10 bp windows over genomic regions of 3kb around the transcript start site (TSS) are shown as heatmaps (red). The average scores over the same genomic regions are shown as separate line for GO:0045599, green and GO:0045600, red. Samples are labelled by the histone marker ChIP antibody and the differentiation stage (0, non-induced; 1, early; 3, late-differentiation).
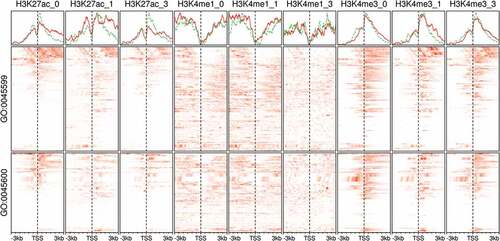
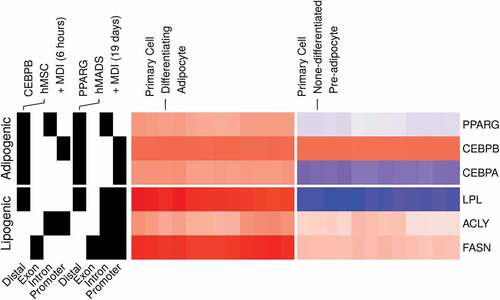
Figure 7. Gene expression and binding patterns of adipogenic transcription factors and lipogenic genes in human primary adipocytes. Probe intensities from microarrays samples (n = 24) from primary pre-adipocytes and differentiating adipocytes were used to estimate the expression (low, blue; high, red) of selected genes (GSE98680). Samples were prepared from primary cells isolated from the subcutaneous fat of healthy human subjects. The isolated cells were induced for differentiation using MDI medium for 10 d. The peaks from ChIP-Seq samples from primary adipocytes were used to represent the binding (present, black; not, white) of adipogenic transcription factors on selected genes. CEBPB and PPARG ChIP antibodies were used in human mesenchymal stem cells (hMSC) (GSE68864) or human multipotent adipose-derived (hMAD) (GSE59703) cells 6 h or 19 d after MDI-induction.