Figures & data
Table 1. Characteristics of patients by body mass index categories.
Figure 1. Relationship of epicardial adipose tissue (EAT) thickness with body mass index (BMI). (a) EAT thickness stratified into standardized BMI categories (normal <25 kg/m2, overweight ≥25 and <30 kg/m2, obese ≥30 kg/m2). The average BMI for each category was: normal patients (n = 8) = 23.3 ± 2.1 kg/m2, overweight patients (n = 28) = 27.7 ± 1.5 kg/m2, obese patients (n = 13) = 33.2 ± 1.6 kg/m2. Statistical differences in EAT thickness between the groups was determined using one-way ANOVA with post hoc Tukey’s multiple comparisons test. **p = 0.0028. Difference between overweight and obese patient EAT thicknesses p = 0.06. Data are presented as mean ± SEM. (b) Simple univariate correlation of EAT thickness vs BMI (range 19.0–35.5 kg/m2). A significant positive correlation was found between EAT thickness and BMI (r = 0.56, p < 0.0001). n = 49.
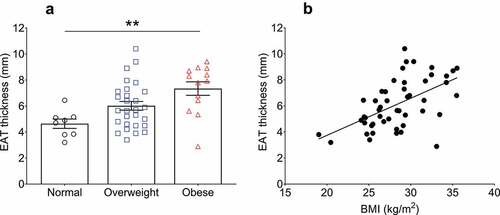
Figure 2. Epicardial adipose tissue (EAT) adipocyte size relationship with body mass index (BMI) and EAT thickness in cardiac surgery patients. Top panel shows representative images of haematoxylin & eosin stained EAT sections. From left to right, images are representative of normal (n = 8), overweight (n = 28), and obese (n = 13) patients as indicated. Scale bar indicates 100 µm. (a) Average adipocyte area is not different between any BMI category. Data are presented as means ± SEM. Statistical difference measured using one-way ANOVA with post hoc Tukey’s multiple comparisons test. (b) Adipocyte area does not correlate with BMI (range 19.0–35.5 kg/m2) or with EAT thickness (c) (r = 0.11, p = 0.5 and r = −0.07, p = 0.6, respectively) as assessed by univariate Pearson correlation. For B and C, n = 49.
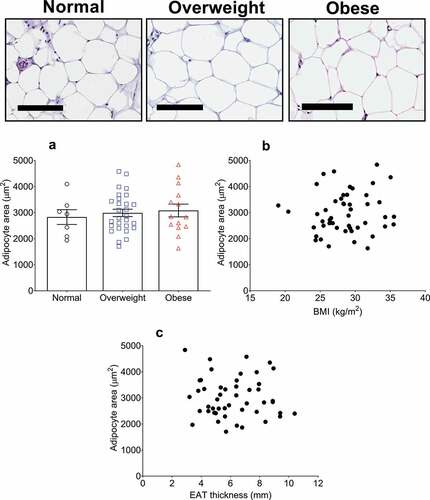
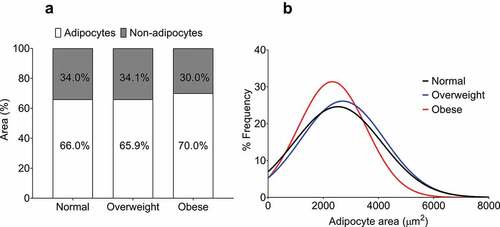
Figure 3. Quantification of non-adipocyte area and epicardial adipocyte size frequency distribution in normal, overweight, and obese groups. (a) Non-adipocyte area is presented as a percentage relative to adipocyte area. No difference was found between the groups as assessed by one-way ANOVA (p = 0.55). (b) Curves fitted from the adipocyte size frequency distributions from normal (886 cells from 8 patients), overweight (1739 cells from 28 patients), and obese (1247 cells from 13 patients) BMI groups. The distribution from the obese group is relatively leftward and upward of the normal and overweight groups, indicating a higher proportion of smaller adipocytes.