Figures & data
Figure 1. Inducible TDTO Expression Induction of TDTO expression in AT explants derived from young, heterozygous, male Adipoq-CreERT2xTDTO reporter mice (b, c) and non-treated controls (a). TDTO fluorescence was detected before and 72 h after TAM induction. Scale bar represents 250 µm
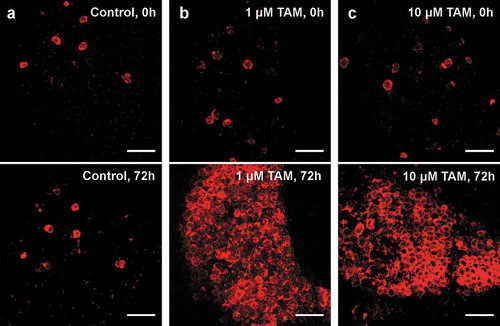
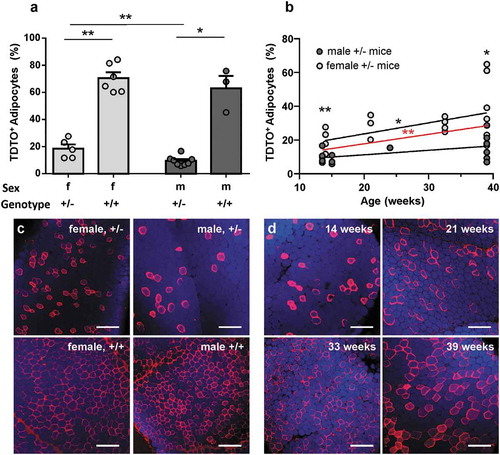
Figure 2. Non-induced TDTO expression in AT from Adipoq-CreERT2xTDTO mice Non-induced TDTO expression is studied in Adipoq-CreERT2xTDTO reporter mice of different sex, genotype and age. A, Bar graph summarizes non-stimulated TDTO expression in young (<15 weeks) Adipoq-CreERT2xTDTO mice of different sex and genotype. B, Linear regression is shown for non-induced TDTO expression in correlation to age of male and female mice. The red line represents the overall regression independent of sex. C and d, representative images for homozygous and heterozygous, female and male mice (c) and for heterozygous, female mice of different ages (d). TDTO fluorescence red, LipidtoxTM fluorescence blue. Data are presented as means ± SEM. Scale bar 250 µm. * p < 0.05 and **p < 0.01