Figures & data
Figure 1. TAS2R38 mRNA gene expression in whole subcutaneous (SAT) and visceral (VAT) adipose tissue of lean subjects (black bars) versus obese patients (white bars) (panel a, OB-SAT vs NW-SAT, **p < 0.01 and OB-VAT vs NW-VAT, *p < 0.05). TAS2R38 gene expression in in vitro differentiated adipocytes (DA) and stroma-vascular fraction cells (SVF) from SAT (white bars, SVF vs DA, *p < 0.05) and VAT (black bars, SVF vs DA, *p < 0.05) of obese patients (panel b). The gene expression is reported as arbitrary units (AU) and normalized by gene expression of RPLP0 (housekeeping gene) (panels a–b). TAS2R38 protein quantification in isolated adipocytes (A), SVF cells and in vitro DA from SAT (white bars) and VAT (black bars) of obese patients by western blotting and densitometric analysis (Arbitrary Densitometric Units, ADU, A, DA vs SVF, *p < 0.05) (c, upper panel). The TAS2R38 and β-Actin protein immuno-detection in one representative blot is shown (c, lower panel)
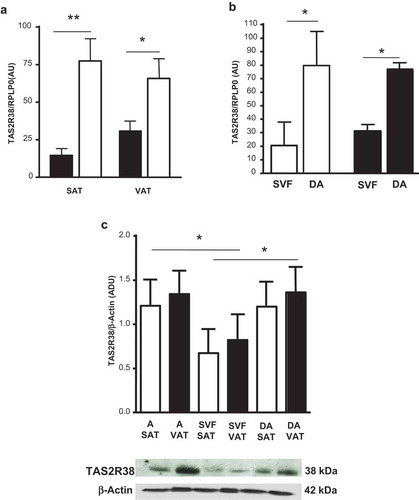
Figure 2. (a) Restriction fragment length polymorphism (RFLP) analysis of TAS gene for P49A SNP. The undigested (U) and HaeIII digested (D) bands are shown in a 4% agarose gel. The DNA fragments of 221 bp, 177 bp, and 44 bp are indicated. In the first and last gel lines, the 100 bp-DNA ladder was loaded. (b) TAS2R38 gene expression by RTqPCR in obese SAT and VAT biopsies by P49A-TAS2R38 gene variants: super taster (TT), taster (Tt) and non-taster (tt). The gene expression is reported as arbitrary units (AU) after normalization with RPLP0 expression (multiple comparisons, NS)
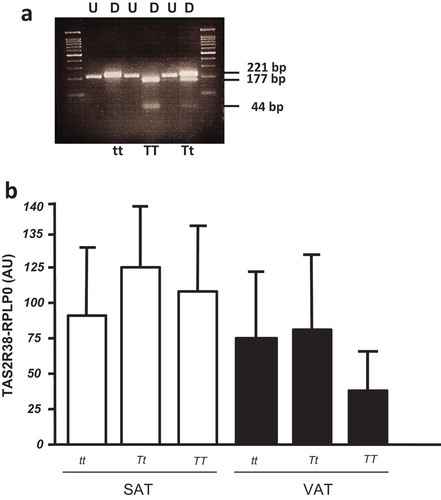
Figure 3. Delipidation (expressed as % of arbitrary fluorescence units, AFU) in in vitro differentiated adipocytes from subcutaneous (SAT, black bars) and visceral (VAT, white bars) adipose tissue after stimulation with three different concentrations of PROP, quinine and caffeine (used as delipidation control). * p < 0.05 and **p < 0.01 vs untreated control (CTR)
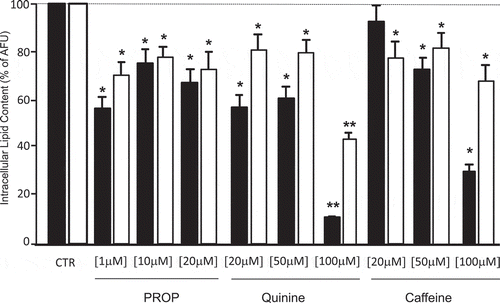
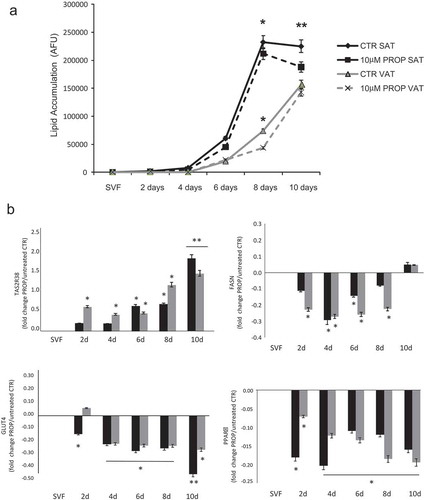
Figure 4. Time course of lipid accumulation rate (arbitrary fluorescence units, AFU) observed in in vitro SAT (black lines) and VAT (grey lines) derived stroma-vascular cells (SVF) during 10 days differentiation into mature adipocytes with 10 µM PROP (dotted lines) and without stimulation (differentiation control, CTR, continuous lines) (panel a). * p < 0.05 and **p < 0.01 vs CTR. Gene expression of TAS2R38, FASN GLUT4 and PPARγ during 10 days in vitro differentiation into mature adipocytes in SAT derived (black blocks) and VAT derived (grey blocks) cells with/without 10 µM PROP stimulation (panel b). The gene expression is reported as fold change (mean±SE) of stimulated/unstimulated cells (* p < 0.05, **p < 0.01, 10 µM PROP treated cells vs untreated control (SVF) of the correspondent time point at 2, 4, 6, 8 and 10 days (d) of differentiation)