
Figures & data
Table 1. Characteristics and details of antibodies used, together with their antigens
Table 2. Primers used to amplify specific genes of the bovine subcutaneous ASC and differentiated adipocytes
Table 3. Experimental concentrations of ascorbic acid (AsA), foetal bovine serum (FBS) and bovine serum lipids (BSL) in the differentiation media used in Experiment 2
Figure 1. Verification of ASC identity. Representative phase contrast microscopic images of (a) pre-adipocytes before induction and (b) developed adipocytes after induction and 14 days in differentiation medium. Lipid droplets are amply present in differentiated adipocytes of graph b. The immunocytochemistry of undifferentiated pre-adipocytes identifies (c) the presence of NT5E (green) and ENG (red), as well as (d) recognition of THY1 (green) and ENG (red). For comparison, inverted light microscopic images using alizarin red staining are shown after 21 days (c) in control medium or (d) in osteogenic differentiation medium. The scale bar is representative of 100 µm in panels a and b (using a 20× objective), 25 µm in panels c and d (using a 63× objective), and 100 µm in panels e and f (using a 10× objective)
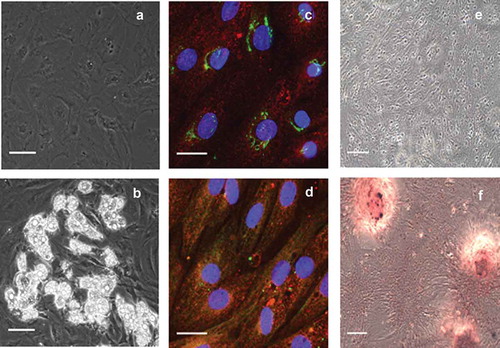
Figure 2. Influence of a gradual decrease in the concentrations of insulin, dexamethasone, rosiglitazone, 3-isobutyl-1-methylxanthine (IBMX) and biotin in the induction medium to 30% and 10% of their original concentrations on lipid incorporation by bovine ASC. The ‘100% medium’ contained 10 µg/mL insulin, 1 µM dexamethasone, 20 µM rosiglitazone, 250 µM IBMX and 33 µM biotin in the recipes used by Riedel et al. [Citation22]. The results are presented as means ± SEM of three independent experiments with two replicates. *Asterisks indicate an effect of factor day with P < 0.05 to day 5
![Figure 2. Influence of a gradual decrease in the concentrations of insulin, dexamethasone, rosiglitazone, 3-isobutyl-1-methylxanthine (IBMX) and biotin in the induction medium to 30% and 10% of their original concentrations on lipid incorporation by bovine ASC. The ‘100% medium’ contained 10 µg/mL insulin, 1 µM dexamethasone, 20 µM rosiglitazone, 250 µM IBMX and 33 µM biotin in the recipes used by Riedel et al. [Citation22]. The results are presented as means ± SEM of three independent experiments with two replicates. *Asterisks indicate an effect of factor day with P < 0.05 to day 5](/cms/asset/355cbb30-12af-4f4f-8bc3-e73fbab7161d/kadi_a_1720480_f0002_b.gif)
Figure 3. Nile red staining of lipids in adipocytes after 2 d in induction medium followed by 7 d or 14 d of incubation in various adipocyte differentiation media. Nile red was imaged at (excitation/emission) 515 nm/590 nm for total lipids (coded to red) and 475 nm/570 nm (emission) for non-polar lipids (coded to green). The green-red overlay results in bright yellow colour for lipid droplets. Nuclei were stained with DAPI and imaged at 358 nm/461 nm (emission). Scale bar = 100 µm (20× objective). The graph A shows quantification of non-polar lipids (475 nm/570 nm) relative to DAPI fluorescence (358 nm/461 nm) for three independent experiments with two replicates while graph B shows corresponding DAPI fluorescence. The data symbolize means ± SEM. a,bMean values with different superscripts are significantly different (P < 0.05). TRT, treatment; Con, negative control; AsA, ascorbic acid; BSL, bovine serum lipids; FBS, foetal bovine serum
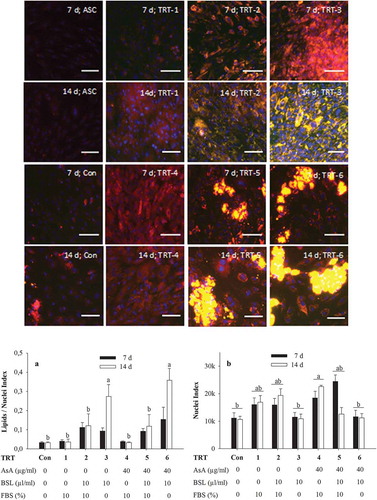
Figure 4. Immunocytochemical classification of bovine subcutaneous adipose-derived stem cells at different stages of development analysed for the presence of different ASC and adipocyte markers. All images were made after 14 d in different types of differentiation media (TRT-1 through TRT-6; for code see ). The colour code of the antigen labels represents the fluorophore colour of the imaged antigen (red or green) and nuclear stain (DAPI, blue), respectively. Scale bar = 25 µm (63 × objective)
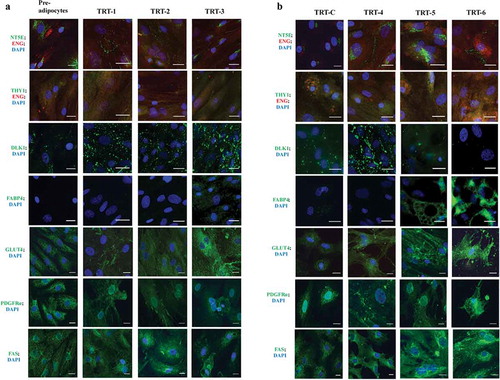
Figure 5. Relative mRNA expression for NT5E, THY1, ENG, PDGFRα, FABP4, LPL, GLUT4 and PPARγ in bovine subcutaneous ASC after in vitro transdifferentiation. Quantitative reverse transcription PCR analysis of NT5E (A), THY1 (B), ENG (C), PDGFRα (D), FABP4 (E), LPL (F), GLUT4 (G) and PPARγ (H) are given as the mean ± SEM of four animals with three replicates. Pre, pre-adipocyte (RNA extracted before induction); Con, negative control; TRT = treatment; FBS, foetal bovine serum; AsA, ascorbic acid; BSL, bovine serum lipids. Letters (a-e) are used to denote statistical difference; columns within one graph are different if they do not share a common letter (P < 0.05)
Table 4. Cell nuclei index and lipid/nuclei ratio of bovine ASC kept for 7 or 14 d intervals in plastic ware with various coatings and differentiation media containing various concentrations of acetic acid (AcA)