Figures & data
Figure 1. Study design. Mice preadipocytes were first cultured in an adipogenic cocktail for 8 d (D0 to D8/DD0) and then the cells were separated into several sets. Set 1, the adipogenic medium was switched to common cell growth culture medium to continue culturing the adipocytes for 8 d (DD8), leading the cells to slowly dedifferentiation ‘spontaneously’, since lack of exogenous insulin although there is still a tiny amount of endogenous insulin in the medium (i.e. it exists in serum), such that the insulin signalling may be insufficient in the adipocytes; Set 2, used same medium as set 1 but additionally supplemented 0.3 μM of OSI-906 (linsitinib) to completely block insulin signal; Set 3, continues use adipogenic medium but supplemented OSI-906 to completely block insulin signal; Set 4, continues the use of adipogenic medium without OSI-906 for 8 d (DD8). From a time point of DD8 (equally RD0 and TD0), the dedifferentiated cells were then recultured in the common cell growth medium supplemented with insulin alone for adipogenic redifferentiation (RD0 to RD8) or transdifferentiation into osteoblasts by stimulatory supplements for 21 d (TD21). The cells were harvested at D0, D8, DD3, and DD8, respectively, for further analyses
Figure 2. Morphological changes in the WT, TNFα-/-, db/db and DT adipocytes at different time points under various conditions as indicated. D8/DD0, the final day of adipogenic differentiation and time point of beginning for dedifferentiation; DD3 and DD8, early and final day of the dedifferentiation of adipogenically differentiated cells, respectively; RD8, the final day of the adipogenic redifferentiation of dedifferentiated cells. As a characterizatic of dedifferentiation, starting from DD1 the adipocytes slowly lose intracellular lipids. The cell morphology was reversed to fibroblast-like shape at DD8 and almost no lipid droplet compared to that of undifferentiated preadipocytes. Scale bar = 20 μm (a). Quantitative analysis of intracellular lipids (b) which equally with the data of ORO staining. DMSO treated cells was used as a control because it was used as a solvent for OSI-906 (0.1% v/v). The results showed no significant effect on the adipogenic differentiation and dedifferentiation of the cells. The data are represented as the means ± SEM, n ≥ 7. **p < 0.01
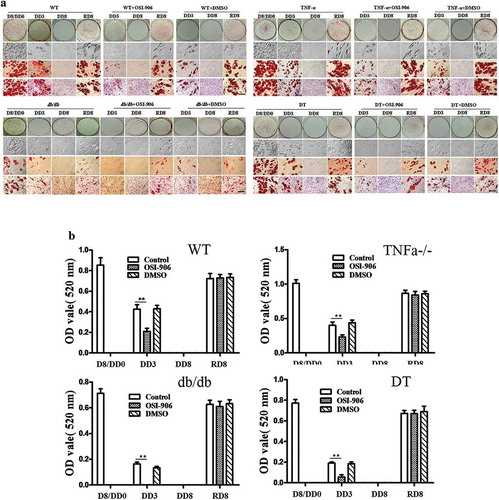
Figure 3. The mRNA expression profile of genes related to insulin receptor signalling, adipogenesis and lipolysis in WT (a), TNFα-/- (b), db/db (c) and DT (d) cells. The data are expressed relative to the control (OSI-906 untreated group, and 0.1% DMSO supplemented) cells at each time point. The target gene transcription level was detected by qPCR. The data are presented as the means ± SEM; n ≥ 5 individual experiments. *p < 0.05 and **p < 0.01 relative to the control group
Figure 4. Protein expression levels of adipogenic molecules and insulin receptor signalling markers in WT, TNFα-/-, db/db and DT cells. The protein levels of adipoQ, GLUT4, total AKT, SREBP1, and pAKT were analysed by Western blotting. D0, initiation day of adipogenic differentiation; D8, the final day of adipogenic differentiation; DD3 and DD8, early and the final day of the dedifferentiation of adipogenic-differentiated cells, respectively; RD8, the final day of adipogenic redifferentiation. The cells were treated with or without OSI-906 as indicated (left panel). Quantitative analysis (right panel). The data are represented as the means ± SEM; n = 5 individual experiments. **p < 0.01 relative to the control group
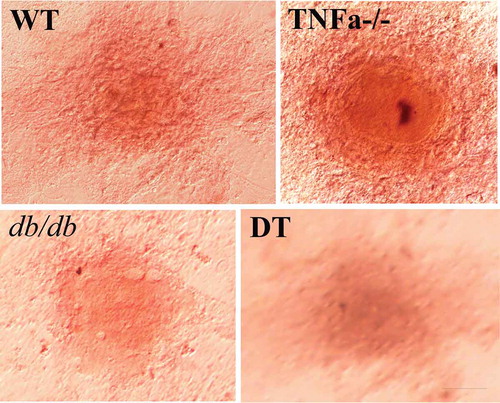
Figure 5. Mineralized deposition in the WT, TNFα-/-, db/db and DT transdifferentiated cells was detected by Alizarin Red staining. The result showed positive staining of cell structure, indicating the dedifferentiated cells can transdifferentiation to osteoblast. The bar indicates 50 μm