Figures & data
Figure 1. Promoter region of Caveolin-1 (CAV1: Chromosome 7, NC_000007.14 (116524785.116561185)) showing the CpGs chosen to be analysed (numbered 1 to 12 and underlined) and the location of each assay (Assay 1 and 2, red boxes) developed to pyrosequencing those CpG targets. Results were calculated by Paired T-test and are shown as average ± SE. * p ≤ 0.025
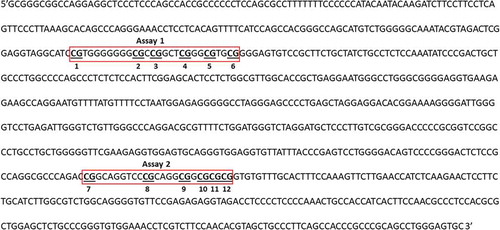
Table 1. Set of primers used for PCR (forward and biotinylated reverse) reactions and pyrosequencing (sequencing) of CAV1 promoter
Table 2. Anthropometric measurements and demographic data of patients submitted to bariatric surgery (n = 12)
Table 3. Panel of genes analysed by RT-qPCR in fat tissue of impaired glucose regulation (IGR) patients (n = 20) before and 6 months after the lifestyle intervention. The results are shown as average ± SE. * p ≤ 0.025
Figure 2. Gene expression of Caveolin-1 (CAV1) in fat tissue (a); buffy coat (b) from patients with impaired glucose regulation (IGR) at baseline and after a lifestyle change (6 months post-intervention); (c) fat tissue from patients submitted to bariatric surgery at baseline and 6 months post-surgery; (d) fat tissue from patients with T2DM history submitted to bariatric surgery at baseline and 6 months post-surgery. Results were calculated by Paired T-test and Bonferroni correction, and are shown as average ± SE. * p ≤ 0.025
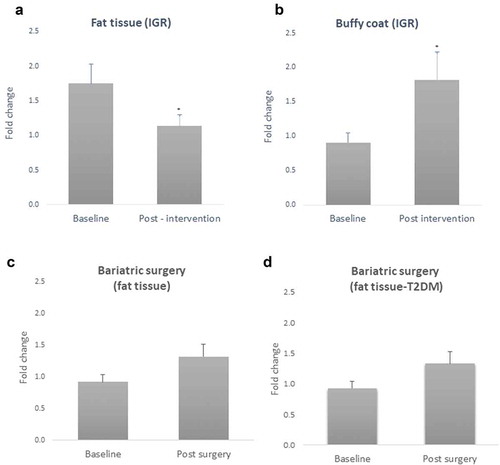
Figure 3. Sex differences in Caveolin-1 (CAV1) gene expression in fat tissue and buffy coat of patients with impaired glucose regulation (IGR) at baseline and after a lifestyle change (6 months post-intervention). Results were calculated by Paired T-test and are shown as average ± SE. * p ≤ 0.025, ** p ≤ 0.01
Figure 4. DNA methylation levels at 12 CpG sites within the promoter region of Caveolin-1 (CAV1) in fat tissue of patients with impaired glucose regulation (IGR) at the baseline and after 6 months of lifestyle change. Results were calculated by Paired T-test and are shown as average ± SE. * p ≤ 0.025
Figure 5. DNA methylation levels at 12 CpG sites within the promoter region of Caveolin-1 (CAV1) in buffy coat of patients with impaired glucose regulation (IGR) at the baseline and after 6 months of lifestyle change. Results were calculated by Paired T-test and are shown as average ± SE. * p ≤ 0.025
Figure 6. LINE-1 methylation in fat tissue and buffy coat of patients with impaired glucose regulation (IGR) at the baseline and after 6 months of lifestyle change. Results were calculated by Paired T-test and are shown as average ± SE. * p ≤ 0.025
Figure 7. Positive Pearson correlation between CpG5 of fat tissue and Caveolin-1 (CAV1) expression in buffy coat of patients with impaired glucose regulation (IGR) after the lifestyle intervention. r = 0.617, p = 0.043
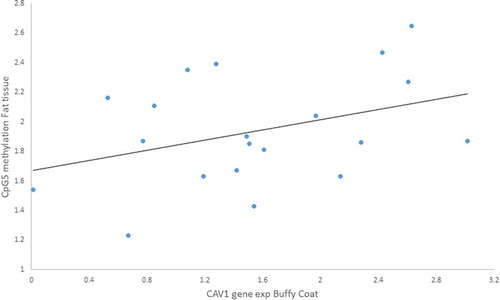
Figure 8. Negative Pearson correlation between CpG6 of buffy coat and Caveolin-1 (CAV1) expression in fat tissue of patients with impaired glucose regulation (IGR) after the lifestyle intervention. r = – 0.606, p = 0.028
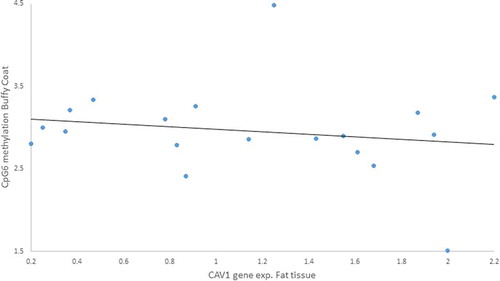
Figure 9. Negative Pearson correlation between CpG7 of buffy coat and Caveolin-1 (CAV1) expression in fat tissue of women patients with impaired glucose regulation (IGR) after the lifestyle intervention. r = – 0.959, p = 0.041
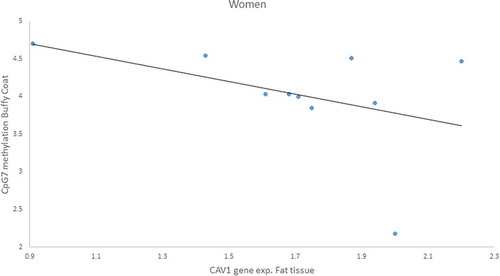
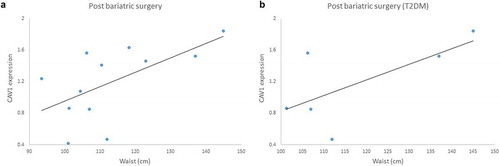
Figure 10. (a) Positive correlation between Caveolin-1 (CAV1) gene expression and waist measurements in patients submitted to bariatric surgery (6 months post-surgery) r = 0.600; p = 0.039. (b) Positive correlation between CAV1 gene expression and waist measurements in patients with T2DM history submitted to bariatric surgery (6 months post-surgery), r = 0.931; p = 0.021