Figures & data
Table 1. The primers and siRNAs used in this study
Figure 1. Effect of serial concentrations of sodium butyrate (SB) on fat accumulation in chicken adipocytes. Chicken preadipocytes were incubated for 8 days with 0.01, 0.1, 0.5, 1, or 2 mM SB in the presence of adipogenic stimuli (AS). (a) Lipid droplets visualized by confocal microscopy in differentiated adipocytes upon bodipy (green)-staining, colocalizing with DAPI (blue)-stained nuclei. Scale bars represent 100 μm. (b) Lipid droplets visualized in differentiated adipocytes upon oil red O (red)-staining. The nuclei were stained with haematoxylin (purple). Scale bars represent 100 px. (c) The stained oil red O was quantified after isopropanol extraction, which was shown as mmol/g total protein. (d) The TG contents from differentiated adipocytes upon different treatments, which were shown as mmol/g total protein. (e) The pure TG contents in differentiated adipocytes upon different treatments, which were shown as mmol/well. (f) Relative mRNA levels of lipogenic markers and FFARs determined by qRT-PCR in the treated cells on day 8. The mRNA levels were normalized to GAPDH. (g) Representative images of western blots and quantitative analysis of the expression of lipogenic markers on day 8 post treatment (n = 3). GAPDH serves as a loading control. Data are the means ± SEM of at least 3 independent experiments. *p < 0.05, **p < 0.01 vs. the control (0 mM SB)
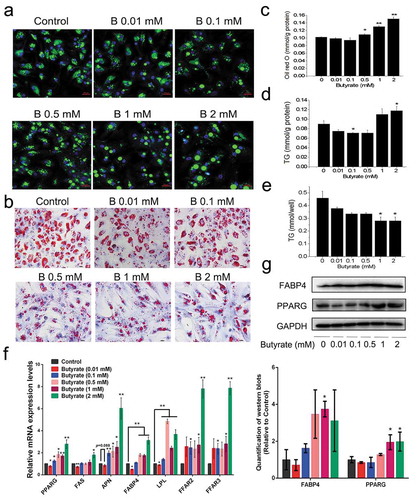
Figure 2. SB inhibits preadipocyte proliferation. (a) EdU assay was performed after the cells were incubated for 24 h with serial concentrations of SB. Confocal microscopy of preadipocytes perfused with EdU (red) and counterstained with Hoechst 33,342 (blue). The EdU/Hoechst 33,342 ratio represents the cell proliferation rate. Scale bars represent 100 μm. (b) CCK-8 assay was conducted to detect cell viability after butyrate treatment. The data are the means ± SEM (n = 6). *p < 0.05, **p < 0.01 vs. the control (0 mM SB)
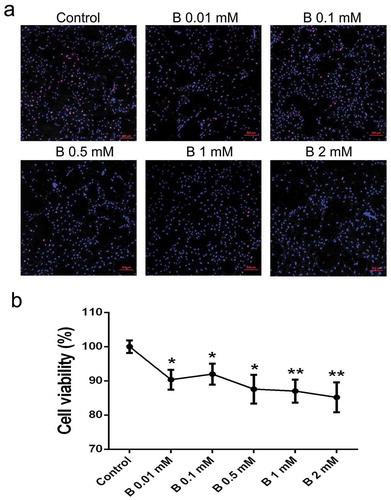
Figure 3. Signalling elucidation of the role of 0.01 mM SB in fat accumulation
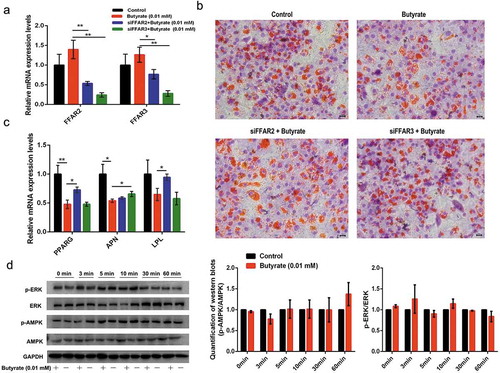
Figure 4. Signalling elucidation of the role of 1 mM SB in fat accumulation
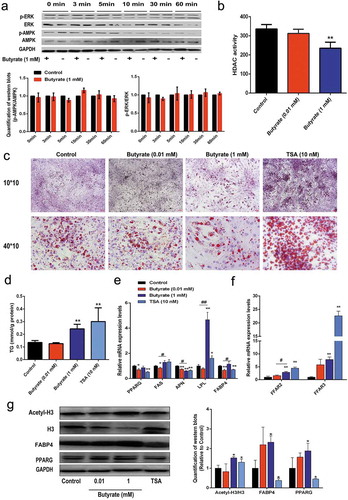
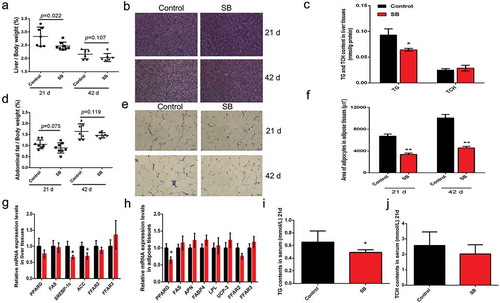
Figure 5. Dietary SB supplementation (0.1%) reduces fat deposition in broilers