Figures & data
Table 1. Comparison of demographic and biochemical characteristics between the n = 80 vs. n = 14 GEMM symptom-free female individuals, showing strong anthropometric and metabolic similarities and non-significant differences
Figure 1. Mean ALR in our symptom-free female participants
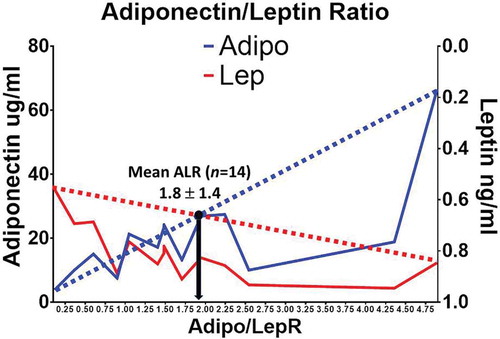
Figure 2. Mean leptin, adiponectin, Adiponectin/Leptin ratio and anthropometric phenotypes of participants in the GEMM study (ALR and Age with a P-value ≤ 0.05)
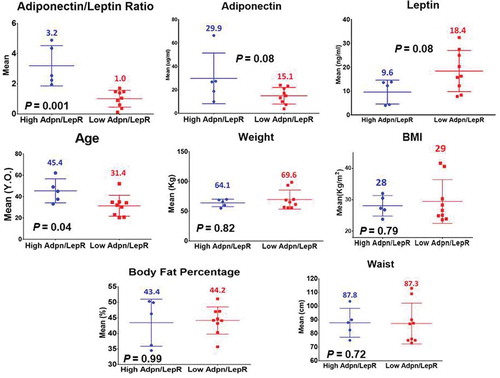
Table 2. High (H: >1.8) and Low (L: <1.8) Adiponectin/Leptin ratio (ALR) according to adipokine concentrations in symptom-free female volunteers who underwent deep phenotyping. P-values for adiponectin mean levels: 0.08; leptin mean levels: 0.08; ARL: 0.001. (A p-value ≤ 0.05 is statistically significant)
Figure 3. Immunometabolic and proinflammatory profile of participants in the GEMM study (non-significant P-values)
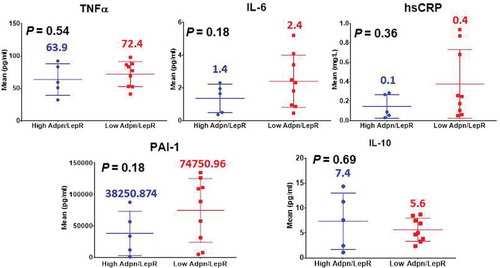
Figure 4. Immunometabolic, insulin resistance, liver enzyme profile, postprandial insulin-glucose axis and triglyceride curves of female participants in the GEMM study (n = 14). Adipo-IR Index, HOMA-IR, ALT/GPT and AST/GOT with a P-value ≤ 0.05. Area under the curve (AUC) for glucose in the (h) ALR group and (l) ALG (13,743 and 13,144, 5% difference [diff.]). AUC for insulin and GLP-1 in the (H) ALR group (5055 and 15,143) compared to the (L) ALG (9362 and 19,327) respectively, showed an 85% and 28% diff
![Figure 4. Immunometabolic, insulin resistance, liver enzyme profile, postprandial insulin-glucose axis and triglyceride curves of female participants in the GEMM study (n = 14). Adipo-IR Index, HOMA-IR, ALT/GPT and AST/GOT with a P-value ≤ 0.05. Area under the curve (AUC) for glucose in the (h) ALR group and (l) ALG (13,743 and 13,144, 5% difference [diff.]). AUC for insulin and GLP-1 in the (H) ALR group (5055 and 15,143) compared to the (L) ALG (9362 and 19,327) respectively, showed an 85% and 28% diff](/cms/asset/b31a75e3-d08c-44a0-986f-97492cafe692/kadi_a_1743116_f0004_oc.jpg)
Table 3. Multi-dimensional mass spectrometry-based shotgun lipidomics. Fed and fasted shotgun lipidomics data from specific classes considered proinflammatory: Lysophosphatidylethanolamine (LPE), Lysophosphatidylcholine (LPC) and Ceramide (Cer)
Table 4. Plasma MicroRNA (miR) in symptom-free females with (H) and (L) ALR. Fed and fasted circulating miRNAs selected from recent literature with adipogenesis-promoting or anti-adipogenic function. miR-27b-5p (fasting and postprandial), miR-375 (postprandial), miR-140-5p (postprandial), miR-130b-3p (fasting and postprandial) with a P-value ≤ 0.05
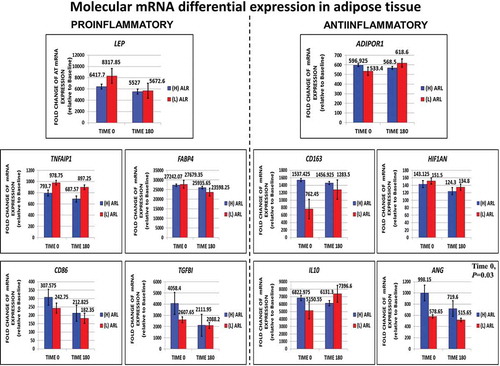
Figure 5. Direct measurements performed for fasting (0ʹ) and fed (180ʹ) subcutaneous fat transcriptomic profiling looking for molecular trends in adipose tissue dysfunction or inflammation differential gene expression in key proinflammatory and anti-inflammatory genes. The expression of the anti-inflammatory gene ANG was significantly decreased in the (l)ALR subgroup in fasting