Figures & data
Figure 1. Insulin stimulates phosphorylation of RXRα at S22 in vitro and in vivo. Representative immunoblots with quantified pRXRα (56 kDa and 65 kDa, separately) and RXRα (56 kDa and 65 kDa together) band intensities in brown pre-adipocytes and mouse BAT presented as mean ± SE. Immunoprecipitation (IP) was performed using control IgG or RXRα antibody (D6H10). A different RXRα antibody (D-20) was used for immunoblotting. Lysate input or immunoprecipitated RXRα were prepared from (a) WT or Rxra−/- brown pre-adipocytes treated with insulin or vehicle; n = 3; or (b) BAT from mice injected with insulin or saline; n = 5; two-tailed t-test or two-way ANOVA with Šídák’s multiple comparison tests. (c) BAT from mice that were fasted or refed for 2 or 6 h; n = 6; one-way ANOVA and Dunnett’s multiple comparison test. (d) BAT from mice that were fed with CD or HFD and were injected with insulin or saline; n = 5–6; two-way ANOVA and Šídák’s multiple comparison test. All phosphoprotein band intensities are normalized to the total amount of each respective protein, except in immunoprecipitation experiments where pRXRα and RXRα are quantified separately. Asterisk (*) represents a significant difference (p < 0.05) from vehicle-treated control cells, fasted mice or saline-injected control mice. Hash (#) represents a significant difference (p < 0.05) from WT cells, BAT RXRα IP or insulin-injected CD mice
Figure 2. Insulin stimulates S22 phosphorylation of RXRα via ERK in precursor and mature adipocytes. Representative immunoblots with quantified pRXRα band intensities presented as mean ± SE; n = 3; two-way ANOVA with Šídák’s and Dunnett’s multiple comparison tests. (a) WT, Irs1−/- or Irs2−/- brown pre-adipocytes were treated with insulin or vehicle. (b) Brown pre-adipocytes were pre-treated with vehicle (DMSO), AKT inhibitor (MK-2206) or MEK inhibitor (U0126), and then stimulated with insulin or vehicle. (c) Brown pre-adipocytes at day 0, 2, 4 or 6 of differentiation were stimulated with insulin or vehicle. All phosphoprotein band intensities are normalized to the total amount of each respective protein. Asterisk (*) represents a significant difference (p < 0.05) from vehicle-treated control cells. Hash (#) represents a significant difference (p < 0.05) from WT cells, DMSO-treated cells or D0 cells
Figure 3. Adipocyte maturation occurs independently of RXRα phosphorylation at S22. (a) WT brown pre-adipocytes were transfected with EV, and Rxra−/- cells were transfected with EV, RxraWT or RxraSA. (b) Immunoblots with quantified band intensities at day 0 or day 6 of differentiation; n = 4; two-way ANOVA and Tukey’s multiple comparison test. All protein band intensities are normalized to vinculin, except for pRXRα and RXRα, which are quantified separately. (c) Gene expression analysis by RT-qPCR showing mRNA levels of adipogenic markers at day 0 or day 6 of differentiation; n = 4; two-way ANOVA and Tukey’s multiple comparison test. (d) Lipid staining with Oil Red O at day 6 of differentiation; n = 3; one-way ANOVA and Tukey’s multiple comparison test. The presented values are mean ± SE. Asterisk (*) represents a significant difference (p < 0.05) from sample indicated with the scarab (¤) sign. Other comparisons are indicated with a hash (#) representing statistical significance (p < 0.05) and n.s. as an abbreviation for non-significance (p > 0.05)
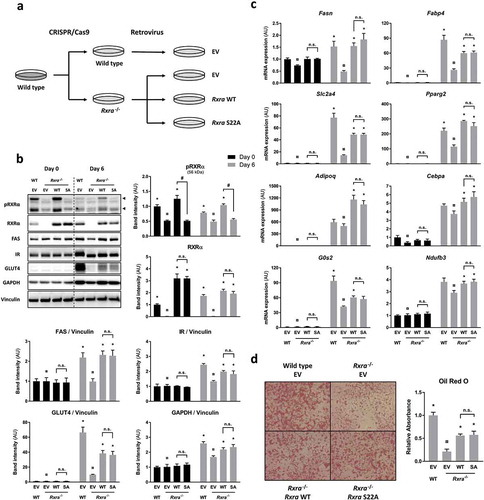
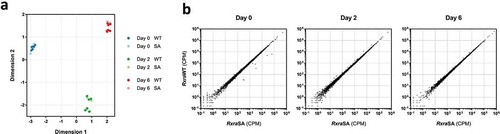
Figure 4. RXRα phosphorylation at S22 is not involved in the regulation of gene expression during brown adipocyte differentiation. Two different Rxra−/- brown pre-adipocyte clones re-expressing RxraWT or RxraSA were differentiated to day 0, 2 or 6, followed by high-throughput RNA sequencing; n = 3 for each cell line. (a) Similarities in gene expression profiles between the four different lines, and across differentiation, are visualized using MDS. (b) Scatter plots illustrating transcript counts per million (CPM) at each time point