
Figures & data
Table 1. Primer sequences (mouse)
Table 2. Primer sequences (human)
Figure 1. The changes of basic metabolism indicator of mice after intervention by miR-455. The BW (g) (a) and RBG (mmol/L) (b) of mice before intervention. (C) (c) The expression of miR-455 in liver of mice. The BW (d) and the RBG (e) of mice after intervention. The serum (f) and liver TG (g) content of mice. n = 6–8 per group
Figure 2. Overexpression of miR-455 improved the liver lipid metabolism. (a) The mRNA expression of PPARγ, FAS, CD36, SCD-1,SREBP-1c and ACCα in the liver of mice in four groups. H&E (b–e) and oil red O staining (f–i) of liver in four groups. Db/m-con group (b + f), db/m-455 group (c + g), db/db-con group (d + h), db/db-455 group (e + i). Magnification ×400. n = 6–8 per group. **P < 0.01 and ***P < 0.001 vs db/m-con group; #P < 0.05 vs db/db-con group
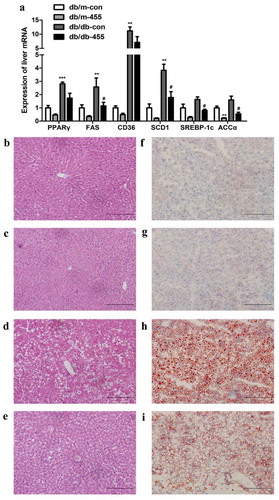
Figure 3. Overexpression of miR-455 ameliorated the liver inflammation and oxidative stress. (a): The mRNA expression of TNF-α, MCP-1 and NOX4 of liver in four groups. (b) The protein levels of SREBP-1c, ACC, FAS and NOX4 in liver of db/db-con group and db/db-455 group, the quantitative analysis results of protein levels. n = 6–8 per group. *P < 0.05 and **P < 0.01 vs db/m-con group; #P < 0.05 and ##P < 0.01 vs db/db-con group
Figure 4. SOCS3 was the target gene of miR-455 in liver. (a) The protein level of SOCS3 in liver in four groups and the quantitative analysis result (n = 6–8 per group). (b) The mRNA expression of PPARγ, FAS, SREBP-1c, ACCα, PPARα and CPT-1 in LO2 cells. The oil red O staining of cells stimulated with BSA (bovine serum albumin) (c) and 0.4 mM PA (d). (e) The expression of miR-455 and SOCS3 in LO2 cells after treatment of miR-455 mimic. (f) The expression of miR-455 and SOCS3 in LO2 cells after treatment of miR-455 inhibitor. (g) The binding sites of miR-455 and SOCS3. Luciferase reporter assay of the interaction between miR-455 and SOCS3 (n = 3 per group). *P < 0.05 vs db/m-con group; ###P < 0.001 vs db/db-con group. +P < 0.05 and ++ P < 0.01 vs BSA group. &P < 0.05 and &&&P < 0.001 vs mimic control group. ^P < 0.05 vs inhibitor control group. *P < 0.05 and ***P < 0.001
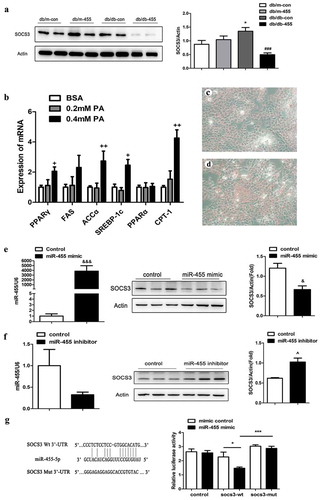
Figure 5. The effect of knocking down the expression of SOCS3 in LO2 cells. The mRNA (a) and protein (b) expression of SOCS3 in LO2 cells after incubated with PA and siRNA-SOCS3. (c) The mRNA expression of SREBP-1c, ACCα, FAS, IL-6, TNF-α and NOX4 in LO2 cells after incubated with PA and siRNA-SOCS3. (d) The protein expression of SREBP-1c, ACCα and IL-6 in cells after c results. n = 3 per group. ◆◆P < 0.05 and ◆◆◆◆P < 0.01 vs PA-control group
Data availability statement
The analysed data sets generated during this study are available from the corresponding author on reasonable request.