Figures & data
Figure 1. Systemic insulin sensitivity and adipose tissue ECM and adipogenic gene expression are altered in obesity. (a) Weekly body weights of mice fed ND or HFD for 8-weeks. *P < 0.001 comparing ND and HFD arms. (b) Organ weights and (c) glucose tolerance test (GTT) performed at end of 8-week of ND or HFD (interaction diet vs. time during GTT: P = 0.044). Area under curve (AUC) for body weight and GTT was calculated by trapezoidal method. (d) Representative fluorescence images of sectioned adipose tissues (scale bars: 100 µm) used for (e) quantifying adipocyte area. Different letters (a-d) represent P ≤ 0.05 using Tukey multiple comparisons analysis. (f) ECM and adipogenic gene expression profile in adipose tissues measured with qPCR, displayed as fold change in transcript levels in VAT and SAT from HFD mice relative to matched tissues from ND mice as referent = 1. Statistical analysis was performed in delta CT values. ns: P > 0.05, *P ≤ 0.05, **P < 0.01, ***P < 0.001, ****P < 0.0001 comparing delta CT values for VAT or SAT in HFD relative to ND mice; n = 8 ND, 8 HFD mice
Figure 2. Depot-specific differences in adipocyte metabolism in response to obesity. Effect of diet and adipose tissue depot on adipogenic differentiation of SAT and VAT adipocytes after 14d of in vitro differentiation in 2D culture demonstrated by lipid accumulation measured with (a) AdipoRed (Lonza) and (b) Oil Red-O staining (scale bars: 100 µm). Different letters (a-c) represent P ≤ 0.05 using Tukey multiple comparisons analysis. (c) Effect of diet on basal and insulin-stimulated glucose uptake in SAT and VAT 2D adipocytes measured with 3 H-2-deoxy-glucose uptake assay. Different letters (a-d) represent P ≤ 0.05 for Tukey multiple comparisons analysis. Statistical analysis for SAT and VAT adipocytes were performed separately. Insulin-stimulated glucose uptake was higher in ND SAT than ND VAT (P < 0.0001), but similar between HFD SAT and HFD VAT (P = 0.395; not indicated on graph). (d,e) Effect of obesity on gene expression of adipogenic and mature adipocyte markers of 2D adipocytes measured by qPCR. In (d), values are shown as log2 fold change in adipocyte gene expression relative to matched undifferentiated preadipocytes as a referent = 1. In (e), values are shown as log2 fold change in VAT adipocytes relative to matched SAT adipocytes as a referent = 1. *P < 0.01, **P < 0.0001 using unpaired t-tests comparing delta CT values between VAT and SAT arms; n = 8 ND, 8 HFD mice
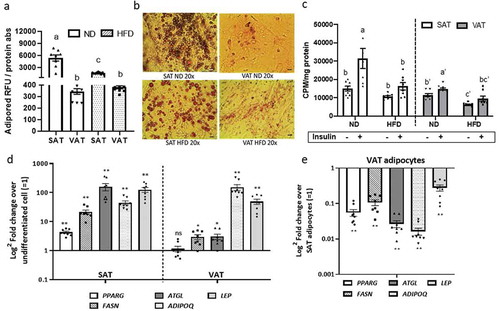
Figure 3. Differentiation of adipocytes in a 3D ECM-adipocyte in vitro culture model. (a) Graphic representation of ECM-adipocyte co-culture system. (b) Photographs, scanning electron micrographs of whole VAT, decellularized VAT, and decellularized VAT ECM repopulated with VAT preadipocytes and differentiated 14 days. Scale bars: 100 µm for all images, except decellularized ECM (10 µm). (c) Light microscopy images of intact VAT 3D-ECM/adipocyte culture (n = 3 male 16-week old C57BL6 mice fed ND) stained with Oil Red-O on different time points during adipogenic differentiation. Images were obtained with a 10X objective on an Olympus CKX41 microscope with Infinity 1 camera and Lumenera software (scale bars: 100 µm)
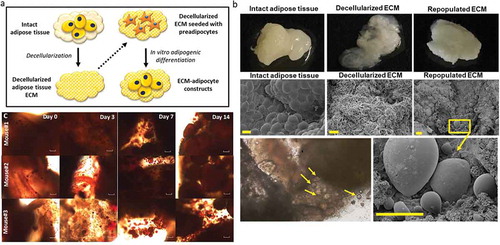
Figure 4. Depot-specific murine ECM-adipocyte metabolic crosstalk (a) Basal and insulin-stimulated (200 nM, 40 min) glucose uptake in combinations of VAT and SAT 3D ECM/adipocytes cultures. Data bars labelled with depot source (VAT, SAT) of ECM and adipocytes (ECM/AD); for example, VAT/VAT denotes both ECM and preadipocytes derived from VAT, while VAT/SAT denotes ECM from VAT combined and preadipocytes from SAT. Empty VAT ECM samples were included as negative controls (n = 5). Separate models were used to analyse the effect of the ECM treatment in systems with and without insulin in glucose uptake assays (as indicated by vertical discontinued bar and apostrophes). Different letters (a-d) indicate P ≤ 0.05 in post hoc pairwise comparisons using Bonferroni’s adjustment for multiple comparison (ECM/adipocytes from n = 18 HFD mice). (b-c) Gene expression of adipogenic (b) and mature adipocyte markers (c) in ECM/adipocyte cultures measured with qPCR. Values are displayed as log2 fold change in gene expression relative in each arm relative to the referent arm of SAT/SAT ECM/adipocytes = 1. Different letters (a-d) indicate P ≤ 0.05 in post hoc pairwise comparisons using Bonferroni’s adjustment for multiple comparisons (ECM/adipocytes from n = 9 HFD mice)