Figures & data
Table 1. miR-130a/miR-301 target genes predicted by several target gene databases. Numbers indicate Total Context ++ score (TargetScan) or PicTar Score (PicTar)
Table 2. Primer sequences used for 3ʹUTR amplification or mutagenesis
Figure 1. OilRed O staining of SGBS preadipocytes on d0, d3, d10 and d14 of adipogenic differentiation. Cells were treated with adipogenic differentiation medium and visualized under magnification x100
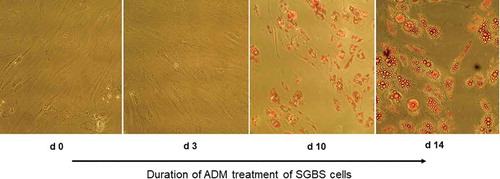
Figure 2. miR-130a and miR-301 expression during adipogenic differentiation of SGBS cells. Legend: black bars: miR-130a expression, grey bars: miR-301 expression. Respective d0 values are set for 100%. Abbreviations: d = day; *p < 0.05; **p < 0.01; n = 3, Student’s t-test, mean ± standard deviation
Figure 3. miR-130a and miR-301 expression during adipogenic differentiation of SGBS cells. Legend: black bars: miR-130a expression under ADM + testosterone treatment, grey bars: miR-301 expression under ADM + testosterone treatment. Dotted line represents the DMSO control individually set for 100%. Abbreviations: d = day; *p < 0.05; **p < 0.01; n = 3, Student’s t-test, mean ± standard deviation
Figure 4. miR-130a and miR-301 expression during adipogenic differentiation of SGBS cells. Legend: black bars: miR-130a expression under ADM + DHT treatment, grey bars: miR-301 expression under ADM + DHT treatment. Dotted line represents the DMSO control individually set for 100%. Abbreviations: d = day; *p < 0.05; **p < 0.01; n = 3, Student’s t-test, mean ± standard deviation
Figure 5. Luciferase reporter assays on the regulation of several target genes by miR-130a. (a): Androgen receptor (AR)-3ʹUTR; (b): Adiponectin (ADIPOQ)-3ʹUTR; (c): Tumour necrosis factor alpha (TNFα)-3ʹUTR. Abbreviations: V = vector; wt = wildtype sequence; mt = mutated sequence; n = 6; *p < 0.05, Student’s t-test