Figures & data
Figure 1. Adipogenesis in EMSC derived adipocytes. (a) Bright field images of WT EMSC derived adipocytes – TOP ROW, left- Differentiated; middle- LPS treatment (10 ng/ml); right- Palmitate treatment (200 μM). Bright field images of Tlr4−/- EMSC derived adipocytes- BOTTOM ROW, left- Differentiated; middle- LPS treatment (10 ng/ml); right- Palmitate treatment (200 μM). (b) Graph depicting ORO absorbance in WT (blue bar) and Tlr4−/- (red bar) EMSC Ad treated with LPS and palmitate. N = 6 per condition; Experiments were performed in duplicates and data is representative of three independent experiments. One-way ANOVA and Student’s t-test was performed for (B). Statistical significance is indicated by *p < 0.05, **p < 0.01, ***p < 0.001, ****p < 0.0001; error bars are SEM. Comparisons of WT Diff vs WT LPS are shown as #p < 0.05, WT diff vs WT Palmitate as p = 0.0763, Tlr4−/-Diff vs Tlr4−/- Palmitate are shown as $$p < 0.01. Diff = Differentiated; Ad = adipocyte
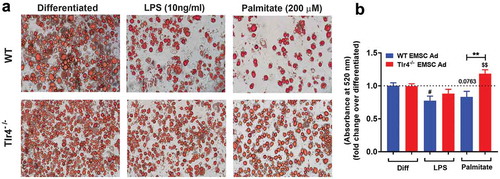
Figure 2. Assessment of adipogenic and inflammatory markers in WT and Tlr4−/- EMSC derived adipocytes. Relative gene expression of adipogenic markers – (a) Pparγ (b) Cebpα (c) Pgc1α. Relative gene expression of inflammatory markers – (d) Il1β (e) Il6 (f) Mcp1. ELISA estimation of (g) IL1β (h) IL6 (i) MCP1. Graph depicts WT (grey bar) and Tlr4−/- (black bar) EMSC Ad treated with LPS and palmitate. N = 5–6 per condition; Experiments were performed in duplicates and data is representative of three independent experiments. One-way ANOVA and Student’s t-test was performed for (a-i). Statistical significance is indicated by *p < 0.05, **p < 0.01, ***p < 0.001, ****p < 0.0001; error bars are SEM. Comparisons of WT Differentiated control vs Tlr4−/- Differentiated control are shown as #p < 0.05. Ad = adipocyte
Figure 3. Assessment of inflammatory markers in WT and Tlr4−/- BMDCs treated with EMSC derived adipocyte conditioned media. Relative gene expression of inflammatory markers – (a) Il1β (b) Il6 (c) Mcp1. ELISA estimation of (d) IL1β (e) IL6 (f) MCP1 in BMDC (DC) after treatment with EMSC derived adipocyte (ad) conditioned media. The experimental groups are: WT BMDC stimulated with WT EMSC Ad Vehicle/Control Conditioned Media (WT EMSC Ad Veh → WTDC), Tlr4−/- BMDC stimulated with Tlr4−/- EMSC Ad Vehicle/Control Conditioned Media (Tlr4−/- EMSC Ad Veh → Tlr4−/- DC), WT BMDC stimulated with Tlr4−/- EMSC Ad treated with LPS (Tlr4−/- EMSC Ad LPS → WTDC), Tlr4−/- BMDC stimulated with WT EMSC Ad treated with LPS (WT EMSC Ad LPS → Tlr4−/- DC), WT BMDC stimulated with Tlr4−/- EMSC Ad treated with Palmitate (Tlr4−/- EMSC Ad Palm → WTDC), and Tlr4−/- BMDC stimulated with WT EMSC Ad treated with Palmitate (WT EMSC Ad Palm → Tlr4−/- DC). N = 5–6 per condition; Experiments were performed in duplicates and data is representative of 3–4 independent experiments. One-way ANOVA and Student’s t-test was performed for (a-f). Statistical significance is indicated by *p < 0.05, **p < 0.01, ***p < 0.001, ****p < 0.0001; error bars are SEM. Ad = adipocyte; DC = dendritic cells, Veh = Vehicle, Palm = Palmitate