Figures & data
Figure 1. Effect of the increasing concentrations of VGVAPG or VVGPGA peptides on ROS production (a and b), activity of caspase-1 (c and d), and resazurin reduction (e and f). Measurement were performed after 3, 6, 24, and 48 h for ROS; after 24 and 48 h for caspase-1 activity; and after 48 and 72 h for resazurin reduction assay in mouse 3T3-L1 cell line. Data are expressed as mean ± SD of three independent experiments, each of which comprised six replicates per treatment group
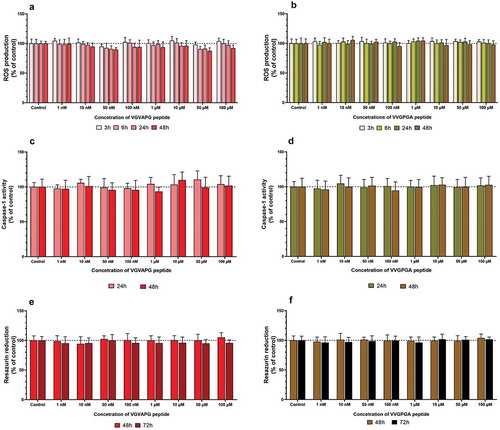
Figure 2. Effect of the increasing concentrations of VGVAPG or VVGPGA peptides on the expression of Ki67 protein. Ki67 level was measured by the ELISA method after 48 h of exposure of 3T3-L1 cell line to the studied peptides. Data are expressed as mean ± SD of three independent experiments, each of which comprised six replicates per treatment group
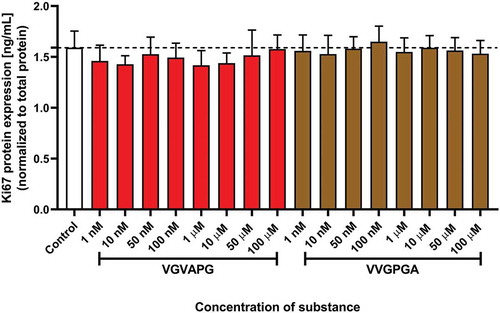
Figure 3. Effect of the increasing concentrations of VGVAPG or VVGPGA (a) peptides on lipid accumulation in 3T3-L1 cell line. Undif – undifferentiated cells; Control – cells differentiated with IBMX, dexamethasone, insulin, without rosiglitazone; Rosi – positive control, differentiated cells with IBMX, dexamethasone, insulin and 2 µM rosiglitazone; groups treated with VGVAPG or VVGPGA were differentiated with IBMX, dexamethasone, insulin and appropriate concentration of VGVAPG or VVGPGA. ORO staining (b) and quantification were performed after 14 days of differentiation
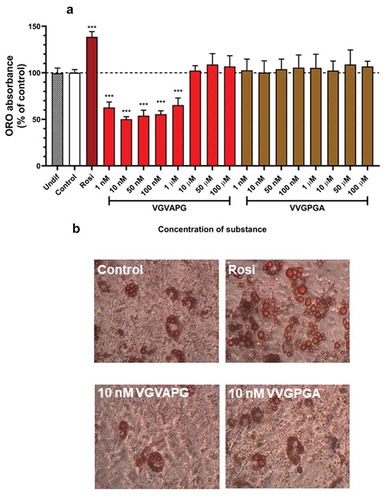
Figure 4. Effect of 10 nM VGVAPG or VVGPGA peptides on the protein expression profile in 3T3-L1 cell line. Control – undifferentiated cells; Rosiglitazone – positive control, cells differentiated with IBMX, dexamethasone, insulin, and 2 µM rosiglitazone; VGVAPG – cells differentiated with IBMX, dexamethasone, insulin, and 10 nM VGVAPG; VVGPGA – negative control VVGPGA peptide that does not activate EBP, cells differentiated with IBMX, dexamethasone, insulin, and 10 nM VVGPGA (a). Protein measurement was performed after 14 days of differentiation. Densitometry was performed by ImageJ 1.52a software (b)
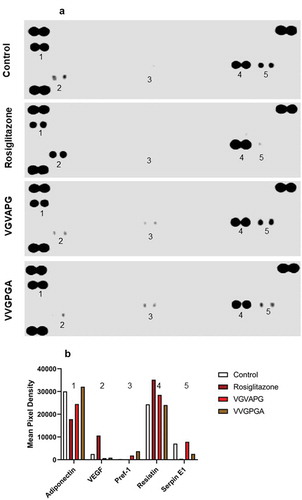
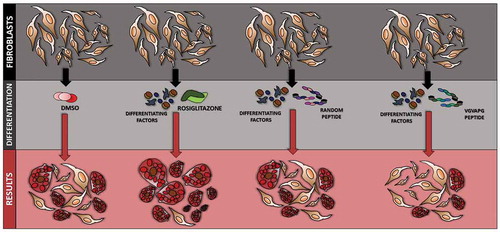
Figure 5. Diagram showing the effect of VGVAPG peptide on the differentiation process in 3T3 cells