Figures & data
Table 1. Primers for quantitative real-time polymerase chain reaction
Table 2. The information of antibodies used in western blot
Figure 1. Changes in the mRNA and protein expression of the Acot2 gene and adipogenic marker genes PPARγ and C/EBPα during the adipogenic differentiation. (a) On the 8th day of the adipogenic differentiation with the oil red O staining. The red part represents lipid droplets (200 ×). (b) Changes in the triglycerides during the adipogenic differentiation. (c-e) Changes in the mRNA expression of Acot2, PPARγ and C/EBPα during the adipogenic differentiation. (f) Changes in the protein expression of Acot2, PPARγ and C/EBPα during the adipogenic differentiation. (g-i) The density analysis of the protein immunoblotting (*P < 0.05, **P < 0.01, ***P < 0.001. Acot2, Acyl-CoA Thioesterase-2; C/EBPα, CCAAT/enhancer-binding protein alpha; PPARγ, peroxisome proliferator-activated receptor gamma)
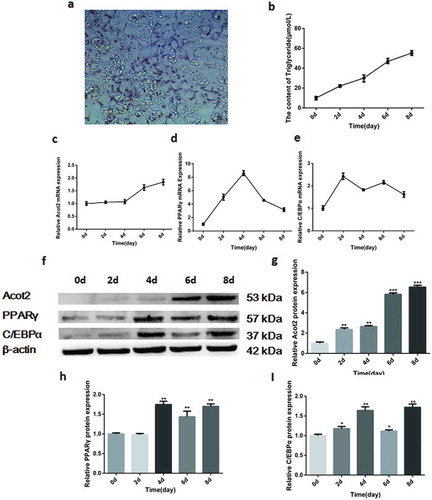
Figure 2. Effects of interfering with the Acot2 gene on the lipid droplet accumulation and triglyceride content. (a) For the interference sequence screening, the Si-1382Acot2 sequence is the best interference sequence. (b) On the 8th day of the adipogenic differentiation with the oil red O staining. The red part represents lipid droplets (200 ×). (c) The content of triglyceride was measured on the 8th day of differentiation in the control and the interference groups. (d) The optical density of the oil red O extract on the 8th day of differentiation was measured in the control and interference groups at 490 nm (lipid droplet quantification) (**P < 0.01, ***P < 0.001, Si-NC is the control group, Si-Acot2 is the interference group)
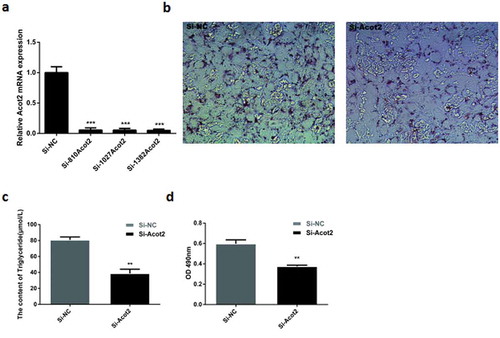
Figure 3. Interfering with the Acot2 gene during the adipogenic differentiation affects the mRNA and protein expression of the PPARγ and C/EBPα genes. (a) Interfering with the change of the Acot2 gene. (b,c) Interfering with the Acot2 gene affects the mRNA expression of PPARγ and C/EBPα. (d) Interfering with the Acot2 gene affects the protein expression of PPARγ and C/EBPα. (e-g) The density analysis of the protein immunoblotting (*P < 0.05, **P < 0.01, Si-NC is the control group, Si-Acot2 is the interference group)
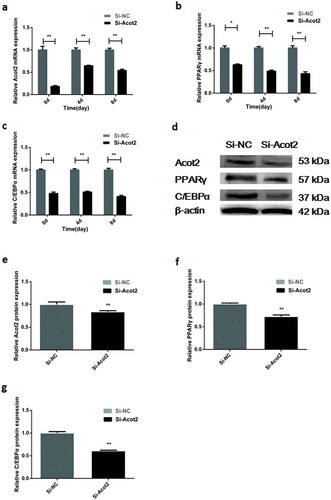
Figure 4. Effects of the overexpression of the Acot2 gene on the lipid droplet accumulation and triglyceride content. (a) Overexpression level verification. (b) On the 8th day of adipogenic differentiation with the oil red O staining. The red part represents lipid droplets (200 ×). (c) The content of triglyceride in the control and overexpression groups was determined on the 8th day of differentiation. (d) Determination of the optical density of the oil red O extract at 490 nm on the 8th day of differentiation in the control and overexpression groups (lipid drop quantification) (**P < 0.01, ***P < 0.001, Over-NC is the control group, Over-Acot2 is the overexpression group)
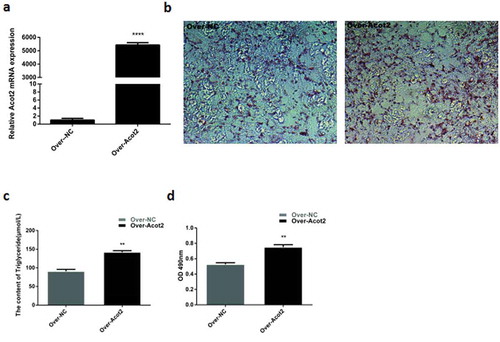
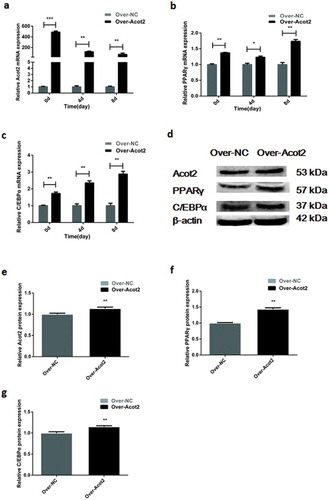
Figure 5. Effects of the overexpression of the Acot2 gene on the mRNA and protein expression of PPARγ and C/EBPα during the adipogenic differentiation. (a) Overexpression with the change of the Acot2 gene. (b,c) Effect of the overexpression of the Acot2 gene on the mRNA expression of PPARγ and C/EBPα. (d) The overexpression of the Acot2 gene affects the protein expression of PPARγ and C/EBPα. (e-g) The density analysis of the protein immunoblotting (*P < 0.05, **P < 0.01, Over-NC is the control group, Over-Acot2 is the overexpression group)