Figures & data
Figure 1. Adipocyte-specific deletion of HuR induces a lean phenotype. (a) Genetic scheme used to induce adipocyte-specific deletion of HuR and representative Western blot showing relative HuR expression in littermate control and Adipo-HuR−/- mice. (b) Adipo-HuR−/- and littermate control mice were placed on a 45% kcal/fat high fat or control diet for 22 weeks with weekly assessment of body weight. (c) Total weight gain in control and Adipo-HuR−/- mice following 22 weeks on 45% kcal/fat high fat or control diet. Total average daily food intake (d) and total activity (e) were assessed in each group using comprehensive lab animal monitoring systems (CLAMS) cages. For b-e, n ≥ 5 per group. **** P ≥ 0.0001 vs control group
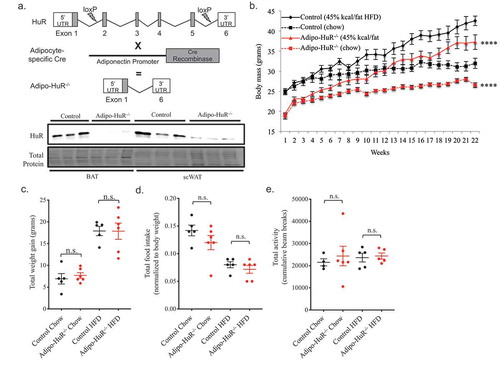
Figure 2. Adipocyte-specific HuR mediates total body composition of fat and lean mass. Body composition of (a) total fat and (b) lean mass were determined by NMR following 22 weeks on chow or HFD. n ≥ 5 per group. *P ≥ 0.05; ** P ≥ 0.01
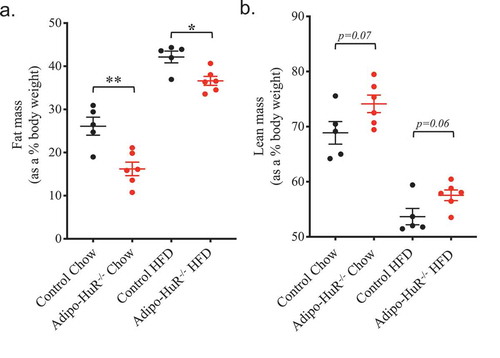
Figure 3. Adipocyte-specific deletion of HuR does not affect serum lipids or glucose tolerance. Total serum (a) phospholipids, (b) cholesterol, (c) triglycerides, and (d) non-esterified fatty acids (NEFAs) were assessed in control and Adipo-HuR−/- mice following 22 weeks on 45% kcal/fat or control diet. Glucose tolerance was assessed in mice fed control (e) or 45% kcal/fat diet (f). n ≥ 5 per group. No statistical significance was found among any groups
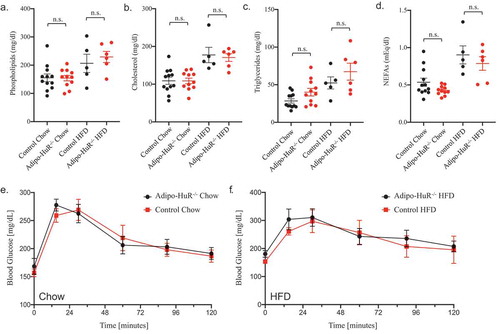
Figure 4. Energy expenditure is increased in Adipo-HuR−/- mice. Daily oxygen consumption (vO2) (a) and vCO2 production (b) were measured using the Oxymax system. Total energy expenditure (HEAT) (c) and respiratory exchange ratio (RER) (d) were then determined based on vO2 and vCO2 values. Shaded area represents dark housing cycle and data is represented as both rolling daily average (left) and total, light, and dark averages (right). n ≥ 4 per group. *P ≥ 0.05; ** P ≥ 0.01
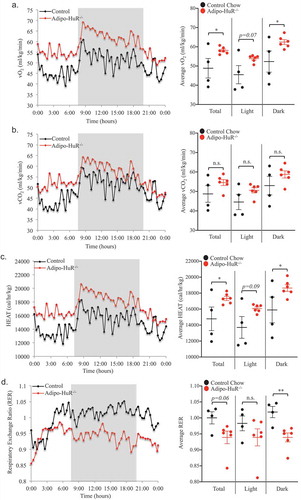
Figure 5. HuR deletion reduces individual fat depot mass and BAT lipid droplet size. Mass of subcutaneous (a), retroperitoneal (b), and gonadal (c) WAT and interscapular BAT (d) were assessed for each animal upon euthanasia. (e) Representative images of whole and H&E stained interscapular BAT from control and Adipo-HuR−/- mice. (f) Quantification of individual lipid BAT droplet size. n ≥ 5 per group. *P ≥ 0.05; ** P ≥ 0.01
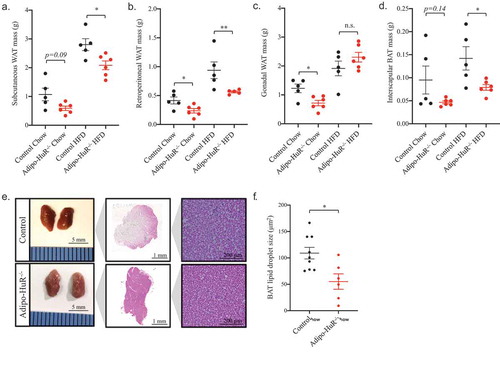
Figure 6. HuR mediates acute thermogenesis independent of UCP1 expression. (a) Control and Adipo-HuR−/- mice were subjected to a 4°C cold challenge with hourly monitoring of core body temperature. (b) Percentage of mice remaining within euthermic core body temperature range (32-37°C) at each hour. (c) Representative thermal images of control and Adipo-HuR−/- mice after 30 and 60 minutes at 4°C. (d) Mice with treated with HuR pharmacological inhibitor (DHTS; 10 mg/kg) or vehicle control and exposed to 4°C cold challenge for 6 hours. (e) Representative Western blot of HuR and UCP1 expression in BAT from control and Adipo-HuR−/- mice. (f) Representative Western blot of UCP1 protein expression in BAT from wild-type mice housed at room temperature (25°C), 4°C, or 4°C in the presence of a HuR pharmacological inhibitor (DHTS; 10 mg/kg) for 6 hours. For a and b, n ≥ 8 per group. *P ≥ 0.05; ** P ≥ 0.01; *** P ≥ 0.001
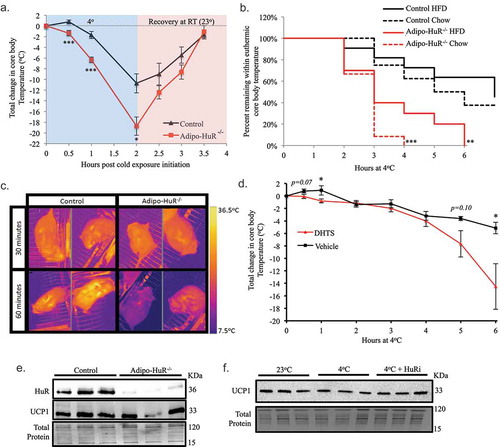
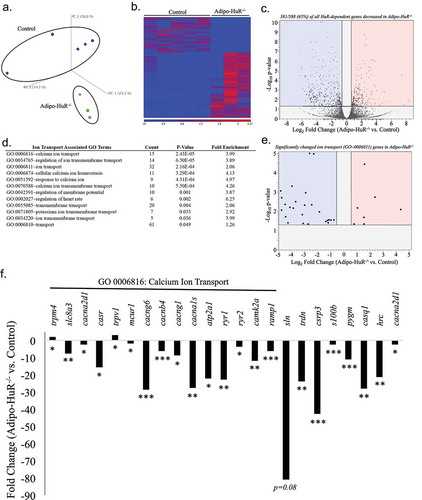
Figure 7. HuR mediates expression of ion transport and calcium cycling genes in BAT. (a) Principal component (PC) analysis of RNA-seq results from total BAT RNA from control and Adipo-HuR−/- mice. (b) Heat map of gene expression differences in BAT from control and Adipo-HuR−/- mice. (c) Volcano plot showing total fold change (log2; x-axis) and p-value (log10; y-axis) of all genes in Adipo-HuR−/- BAT relative to control BAT. Blue and red regions represent significantly down and up-regulated genes, respectively. (d) A list of all significantly enriched Ion Transport associated GO Terms among HuR-dependent gene expression in BAT. (e) Volcano plot showing total fold change and p-value of significant HuR-dependent changes among genes in the Ion Transport parent gene ontology. (f) HuR-dependent gene expression changes within the Calcium Ion Transport gene ontology (denoted above the x-axis) as well as additional significant calcium transport genes. n = 5 control BAT; n = 3 Adipo-HuR−/- BAT. *P ≥ 0.05; ** P ≥ 0.01; *** P ≥ 0.001