Figures & data
Figure 1. TSH promotes adiposity and its metabolic consequences. SCH: subclinical hypothyroidism mice; NC: normal control mice; TPO-Tshr: TPO-Cre/Tshrflox/flox mice; WT: wild-type littermates. AUC: area under curve; ACC: area above curve. (a) Body weight of the control and SCH mice (n = 10). (b) Body weight evaluation of the TPO-Tshr mice treated with TSH or vehicle for 2 weeks (n = 6). (c) Weight of eWAT, iWAT and BAT normalized to the body weights of the control and SCH mice (n = 8). (d) Weight of eWAT, iWAT and BAT normalized to the body weights of TPO-Tshr mice injected with TSH or vehicle (n = 6). (e, f) Results of the OGTT (f) and ITT (g) in the control and SCH mice (n = 8). The values represent the means ± s.e.m. Error bars represent s.e.m. Significant differences in SCH compared with NC mice and TPO-Tshr mice treated with TSH compared with vehicle controls are indicated by *P < 0.05, **P < 0.01 and ***P < 0.001 (Student’s t-test or 2-way ANOVA with repeated measures and Bonferroni post-hoc tests)
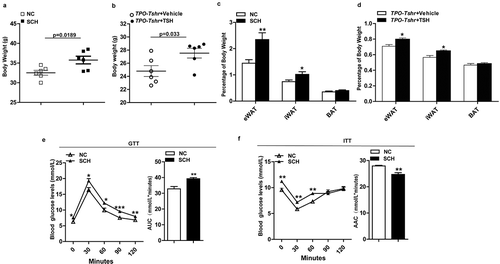
Figure 2. Elevated TSH levels reduces energy consumption
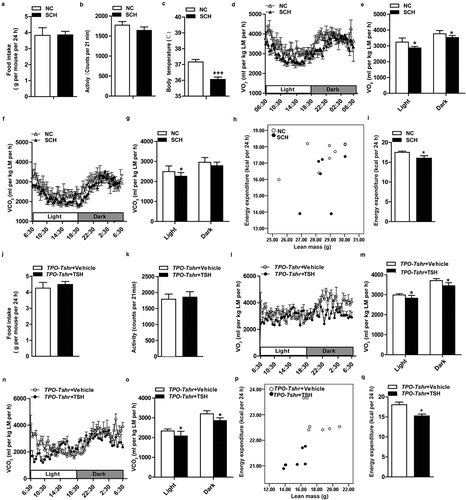
Figure 3. Tshr-knockout mice resist adiposity and its metabolic complications
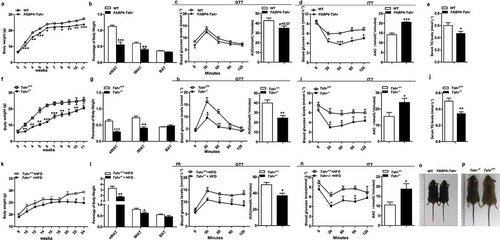
Figure 4. Tshr knockout increases energy expenditure
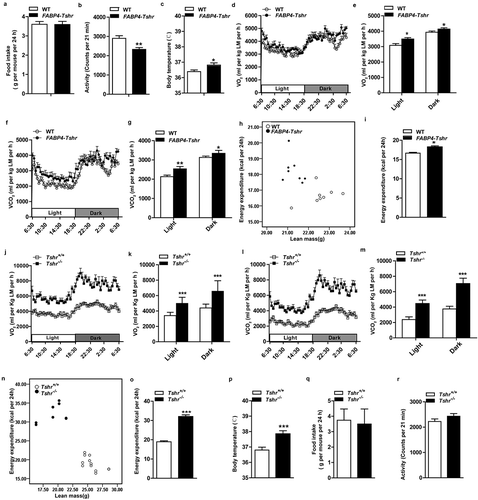
Figure 5. Tshr knockout induces the white-to-brown fat transition in Tshr−/- mice
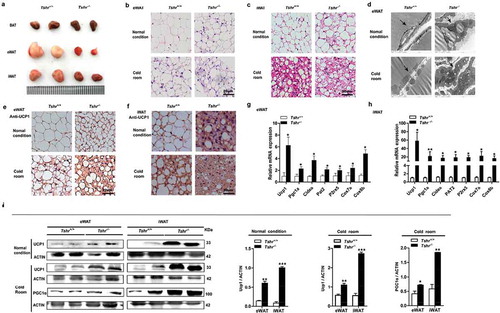
Figure 6. Tshr knockout induces the white-to-brown fat transition in FABP4-Tshr mice
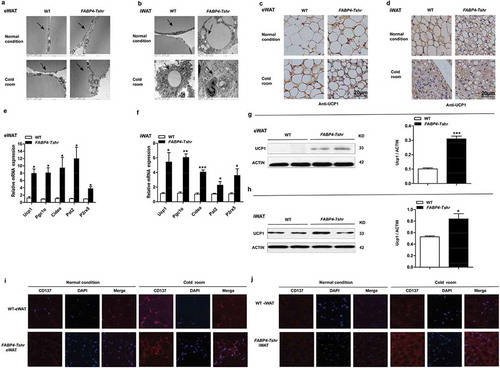
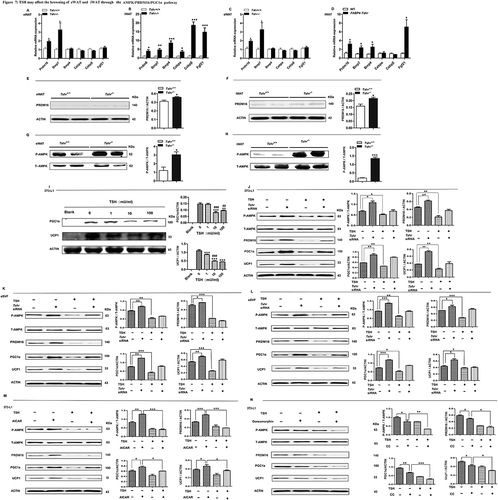
Figure 7. TSH may affect the browning of eWAT and iWAT through the AMPK/PRDM16/PGC1α pathway