
Figures & data
Figure 1. Characterization of lipoma tissue from a patient with phosphatase and tensin homolog (PTEN) hamartoma tumour syndrome
Representative images of PTEN detection by immune histochemistry of (a) subcutaneous adipose tissue, (b) lipoma tissue and (c) perirenal adipose tissue of the patient with PHTS; bar = 500 µm; gene expression of (d) PTEN, and white adipose tissue markers (e) peroxisome proliferator-activated receptor γ (PPARγ), (f) adipocyte binding protein 2 (aP2), (g) fatty acid synthase (FASN), (h) adiponectin and (i) the brown adipocyte marker uncoupling protein 1 (UCP 1) was quantified in different adipose tissue depots. Data were normalized to TATA-box binding protein (TBP) and hypoxanthine phosphoribosyltransferase (HPRT) expression and presented as mean±SEM. n = 4 for PTEN, n = 3 for other genes. subc: subcutaneous, peri: perirenal, pre: prerenal
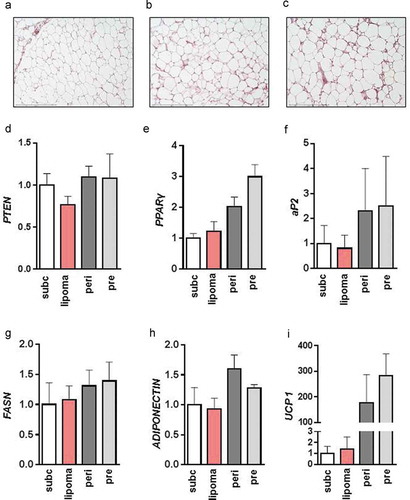
Figure 2. Growth and adipocyte differentiation of LipPD1 cells during long-term culture
(a) Quantification of lipid accumulation in LipPD1 cells cultured for 80 population doublings and in vitro differentiated into adipocytes every three passages. Nile Red stained cells were counted and normalized to cell number as determined by DNA staining. Data are presented as mean±SEM, n = 3 independent experiments in quadruplicates. *Data for SGBS and controls 1–3 were taken from [Citation5] (b) Quantification of lipid accumulation in SGBS (generation/population doublings 42.5 and 43.5, cultured for approximately 90 d), LipPD1 (generation/population doublings 20.5 and 21.5, cultured for approximately 40 d) and stromal-vascular fraction cells from two different healthy donors (SVF#6 generation/population doublings 30 and 31, cultured for approximately 60 d) and SVF#10, generation/population doublings 27.5 and 28.5, cultured for approximately 55 d) in vitro differentiated into adipocytes until day 8. Nile Red was normalized to Hoechst-33324 fluorescence intensity. Representative images of differentiated cells stained with Oil Red O. bar = 500 µm; Data are presented as mean±SEM, n = 2 independent experiments in 9-tuplicates. +p < 0.05 determined by one-way ANOVA, 0 F: undifferentiated LipPD1 cells expression of adipocyte marker genes (c) peroxisome proliferator-activated receptor γ (PPARγ), (d) fatty acid synthase (FASN), (e) adipocyte binding protein 2 (aP2), (f) leptin and (g) adiponectin, in LipPD1 (cultured 40–60 d) compared to SGBS (cultured 80–90 d) and stromal-vascular fraction cells from two healthy donors (SVF#6, cultured 40–50 d and #10, cultured 30–50 d), on day 0 and 8 of adipocyte differentiation. Data were normalized to TATA-box binding protein (TBP) and presented as mean±SEM. n = 3 independent experiments in triplicates.
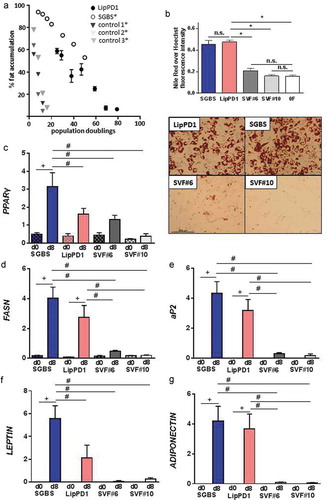
Figure 3. Functional characteristics of LipPD1 compared to SGBS adipocytes
(a) Isoproterenol-induced lipolysis and (b) insulin-stimulated 14 C-deoxyglucose uptake is comparable between LipPD1 and SGBS adipocytes. (c) LipPD1 and SGBS cells were cultured as spheroids in 3D differentiation culture for 9 d, photos were taken every 3 d. Representative images (100x) are shown of LipPD1 and SGBS spheroids differentiated to day 9, fixed in 4% paraformaldehyde and stained with Nile Red (lipids) and Hoechst-33324 (DNA). Expression of adipose differentiation marker genes in 3D in vitro differentiation: (d) peroxisome proliferator-activated receptor γ (PPARγ) and (E) adiponectin. TATA-box binding protein (Tbp) was used for normalization. Data were normalized to the mean of SGBS d4 differentiated cells. Data are presented as mean±SEM, n = 3 independent experiments #p < 0.05 determined by two-way ANOVA.
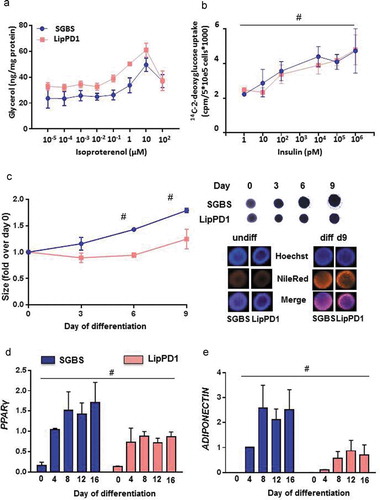
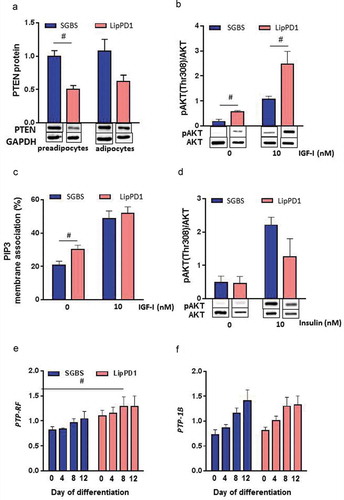
Figure 4. PI3 K signalling is constitutively activated in LipPD1 preadipocytes
Western blot analysis of (a) PTEN protein in SGBS and LipPD1 preadipocytes and after adipocyte differentiation phosphorylated AKT (Thr308) protein in (b) SGBS and LipPD1 preadipocytes under basal conditions and after IGF-I (10 nmol/l) stimulation and in (d) SGBS and LipPD1 adipocytes under basal conditions and after insulin (10 nmol/l) stimulation. (c) Percentage of membrane-associated fluorescent PIP3 analogue determined per total internal reflection/fluorescence redistribution after photobleaching (TIR/FRAP) in SGBS and LipPD1 preadipocytes under basal conditions and after IGF-I (10 nmol/l) stimulation. Data are presented as mean±SEM, n = 3 independent experiments, #p < 0.05 determined by Student’s t-test. Expression of (e) PTP receptor type F (PTP-RF) and (f) protein-tyrosine phosphatase (PTP)-1B in SGBS and LipPD1 cells during adipocyte differentiation presented as mean±SEM of n = 3 independent experiments. # p < 0.05 determined by two-way ANOVA comparing LipPD1 to SGBS preadipocytes.
Supplemental material