
Figures & data
Figure 1. Sample of images used to develop and test AdipoGauge. a) H & E stained mouse adipose tissue image; b) Fluorescently stained macrophages from mouse adipose tissue fixed sections; c) H & E stained human breast tissue section (containing adipose tissue) used for colour separation
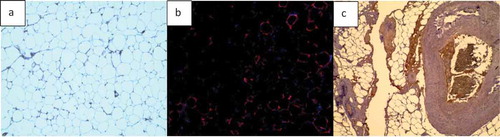
Figure 2. Haze removal process
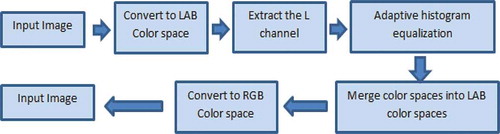
Figure 3. Loading multiple images in software
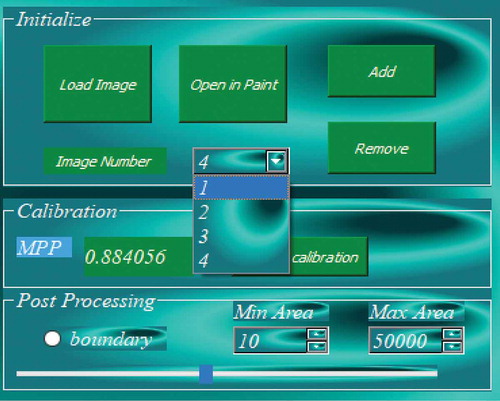
Figure 4. Loading the image in Microsoft Paint to connect the cell border manually
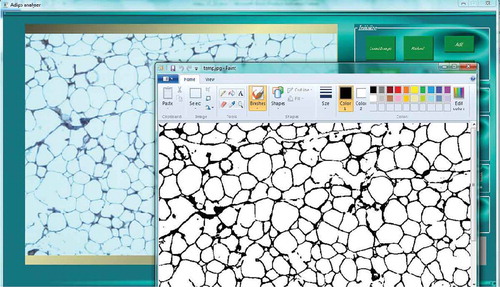
Figure 5. Cell counting flow diagram
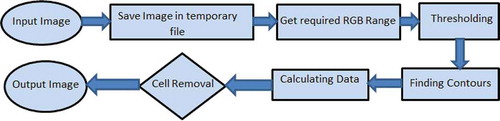
Figure 6. Colour separation flow diagram
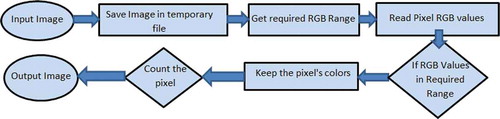
Figure 7. Adipose tissue histology section for image calibration. a) Manual calibration b) Automatic calibration
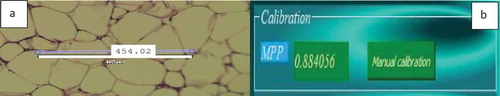
Figure 8. Adipose tissue histology section
Figure 9. Adipose tissue histology sections for cell measurements. a) Image includes border cells b) Image without border cells
Figure 10. Adipose tissue H&E stained section. a) Image with a scratch b) Segmented cells image in which the scratch is excluded from the analysis
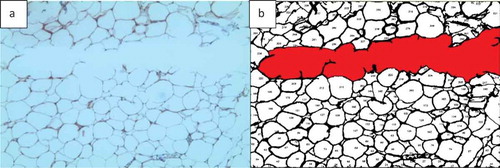
Figure 11. Excluding border cells and output of Image 1A analysis. a) Cells counted by ImageJ. b) Cells counted by AdipoGauge after manual processing of the image using Microsoft Paint
Table 1. Data analysis (cell number and size) for adipocytes in by ImageJ and AdipoGauge
Figure 12. Histogram of area of adipocytes from. )
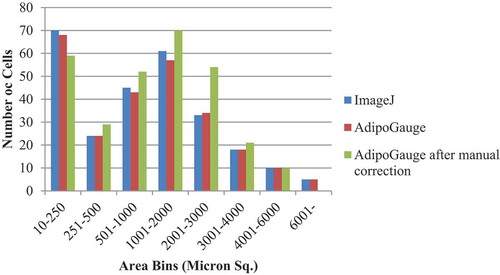
Figure 13. Adipose tissue histology sections a) Fluorescently stained image b) Red channel c) Blue channel d) Green channel
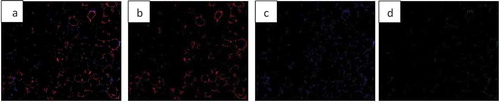
Figure 14. Adipose tissue sections: Image conversion into black & white to enhance visibility. a) Blue area of ) (nucleus). b) Green area of )
Figure 15. Breast tissue H&E stained section. a) H & E stained image; b) Specified colour range ‘reddish brown’ is separated out
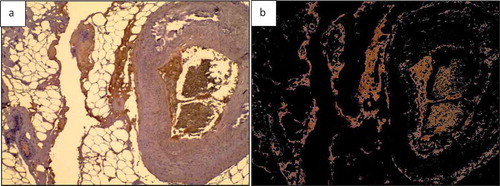
Figure 16. Adipose tissue H&E stained sections. a) Section with clear cell membranes/borders b) Section with low quality cell membranes/borders
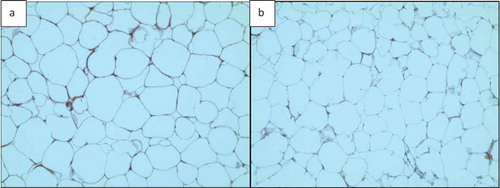
Figure 17. Output of cell counting results for. ). a) Original Image of adipose tissue histology. b) ImageJ image. c) AdipoGauge image. d) Cells that were counted differently in ImageJ in red. e) Cells that were counted differently in AdipoGauge in blue
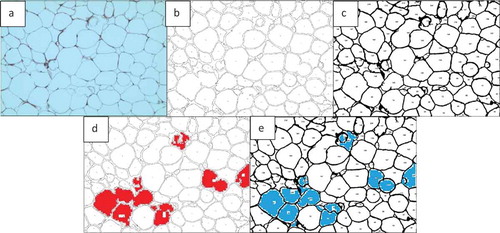
Table 2. Data analysis for ) by ImageJ and AdipoGauge
Figure 18. Comparison of output results for image in. ). a) Original Image of adipose tissue histology. b) Image analysed by ImageJ. c) Image analysed by AdipoGauge. d) Cells counted differently in ImageJ. e) Cells counted differently in AdipoGauge
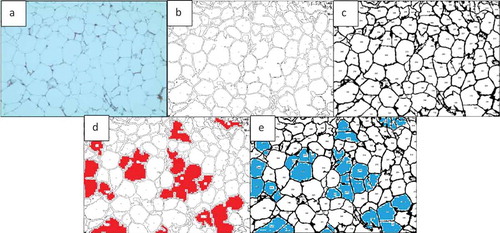
Table 3. Data analysis for ) by ImageJ and AdipoGauge
Figure 19. Fluorescent image of macrophage staining in adipose tissue of obese mice fed a high-fat diet. (a). Original Image (b). Image analysed for macrophage detection from AdipoGauge. (c). Analysis result from ImageJ
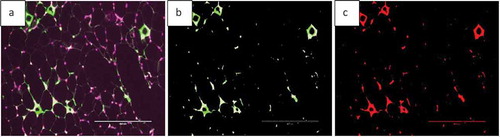
Figure 20. Fluorescent image of macrophage staining in adipose tissue of obese mice fed a high-fat diet supplemented with fish oil (using galectin). (a). Original Image (b). Image analysed using AdipoGauge. (c). Analysis using ImageJ
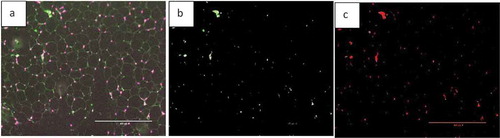
Table 4. Data analysis for area of interest (Macrophage) by ImageJ and AdipoGauge