Figures & data
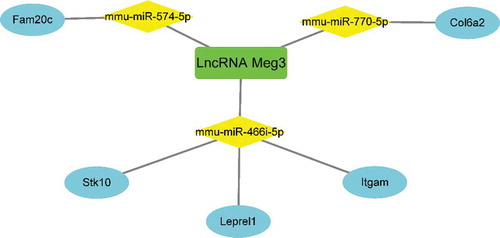
Figure 1. Volcano plot analysis to identify DE RNAs. Red dots represent 1,203 upregulated RNAs and green dots represent 134 downregulated RNAs in BAT from mice fed an HFD or an ND. DE RNA: differentially expressed RNA; HFD: high-fat diet; ND: normal diet; BAT: brown adipose tissue
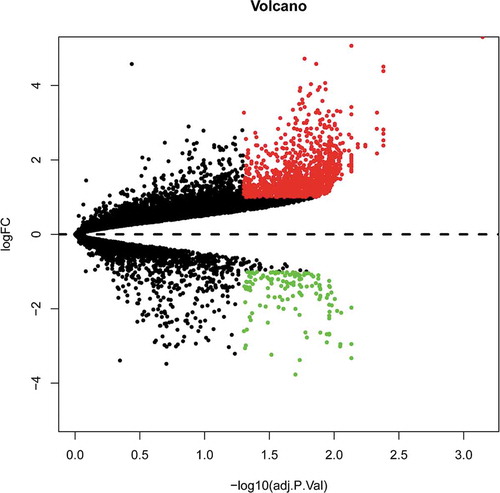
Figure 2. Heatmap of 1,249 DE mRNAs screened using the limma package in R. Red areas represent upregulated genes and green areas represent downregulated genes in BAT from mice fed an HFD compared with mice fed an ND. DE mRNA: differentially expressed mRNA; HFD: high-fat diet; ND: normal diet; BAT: brown adipose tissue
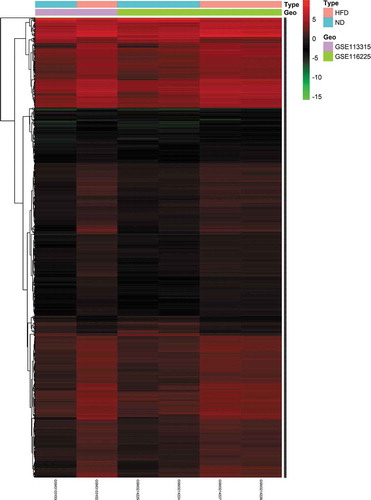
Figure 3. Heatmap of 74 DE lncRNAs screened using the limma package in R. Red areas represent upregulated genes and green areas represent downregulated genes in BAT from mice fed an HFD compared with mice fed an ND. DE lncRNA: differentially expressed lncRNA; HFD: high-fat diet; ND: normal diet; BAT: brown adipose tissue
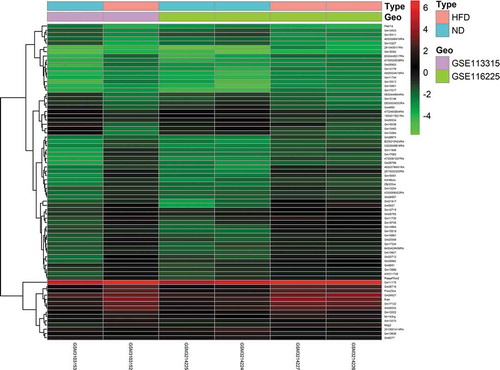
Figure 4. GO enrichment results for DE mRNAs. The x-axis represents the gene ratio and the y-axis represents GO terms. The size of the circle indicates the gene count. Different coloured circles indicate different adjusted p values. DE mRNA: differentially expressed mRNA; FDR: false discovery rate; GO: gene ontology
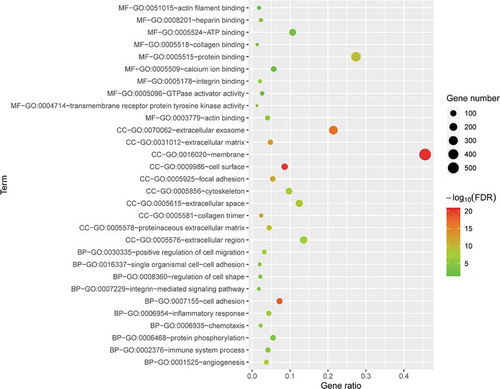
Figure 5. KEGG pathway analysis of differentially expressed genes. Advanced bubble chart shows enrichment of DE mRNAs in signalling pathways. The y-axis represents the pathway and the x-axis represents the rich factor (rich factor = number of DE mRNAs enriched in the pathway/total number of DE mRNAs in the background gene set). The size and colour of the bubble indicates the number of DE mRNAs enriched in the pathway and the enrichment significance, respectively. KEGG: Kyoto Encyclopaedia of Genes and Genomes; DE mRNA: differentially expressed mRNA; FDR: false discovery rate
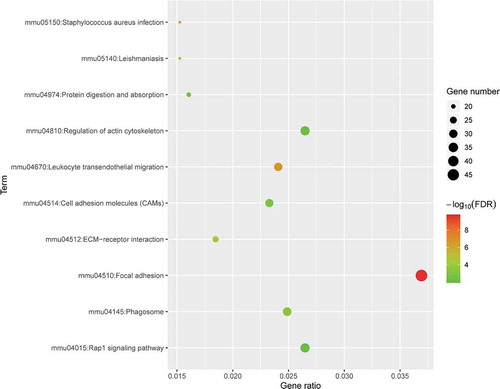
Table 1. 79 DEmRNAs of the most significant module (score = 17.838) in the BAT between the HFD and ND groups
Figure 6. The PPI network and the most significant modules of DE mRNAs. (a) The PPI network was analysed using STRING. There were 1,250 nodes and 2,449 edges in the PPI network. (b) The most significant module identified by MCODE (score = 17.538). DE mRNA: differentially expressed mRNA; PPI: protein-protein interaction
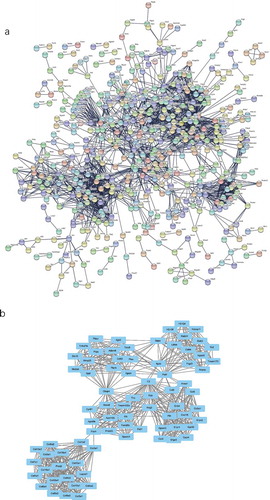
Table 2. Target miRNA prediction of lncRNA Meg3 and corresponding target mRNAs prediction
Figure 7. The network of Meg3 as a ceRNA. Green indicates lncRNAs; yellow indicates miRNAs; blue indicates mRNAs
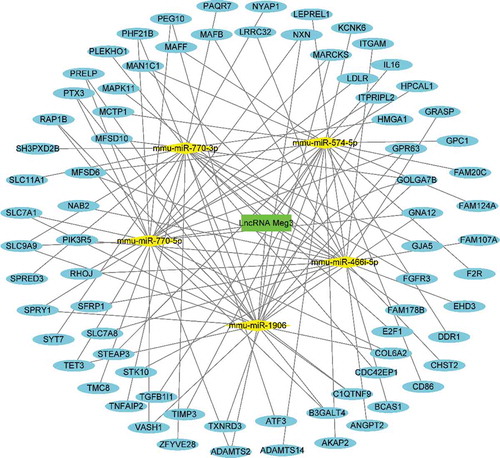
Figure 8. Five genes identified as hub genes modulated by Meg3 as a ceRNA in BAT from mice on an HFD. Green indicates lncRNAs; yellow indicates miRNAs; blue indicates mRNAs