Figures & data
Figure 1. SFRP4 is highly expressed in ob/ob mice. (a) Construction of transgenic expression vector. (b) Expression of SFRP4 in various tissues of wild type (WT) mice, as determined by qPCR. (c) Expression of SFRP4 in various tissues of ob/ob mice, as determined by qPCR. (d) Western blotting analysis of SFRP4 expression in the plasma of WT and ob/ob mice. The data are expressed as the mean ± SEM, n = 6 for each group. *P < 0.05, vs. WT mice. ig WAT, inguinal white adipose tissue (subcutaneous adipose tissue); epi WAT, epididymal white adipose tissue (visceral adipose tissue)
Table 1. The sequences of primers used in this study
Figure 2. The expression of SFRP4 was increased in Tg mice. (a) SFRP4 mRNA expression was determined in the liver of Tg mice and WT littermates. (b) and (c) SFRP4 expression in the liver (B) and plasma (C) was determined by western blotting (β-actin was used as a loading control). A representative blot and data quantification from three independent experiments are shown. Data are expressed as the mean ± SEM, n = 6 for each group. *P < 0.05, **P < 0.01 vs. non-Tg
Figure 3. Body mass, fat mass, and liver weight in Tg mice. (a) Body weight changes in Tg mice and non-Tg littermates. (b) The ig WAT weight, epi WAT weight, and liver weight of non-Tg and Tg-SFRP4 mice. Data are expressed as the mean ± SEM, n = 8 for each group. **P < 0.01 vs. non-Tg
Figure 4. Adipocyte size was smaller in the epi WAT of Tg mice compared to WT littermates. (a) Representative image of adipocyte staining with haematoxylin & eosin. (b) The area of adipocytes was measured in Tg mice and non-Tg littermates. (c) A frequency distribution plot of cell diameters was calculated to determine the mean diameter of fat cells. Data are expressed as the mean ± SEM, n = 8 for each group. *P < 0.05 vs. non-Tg
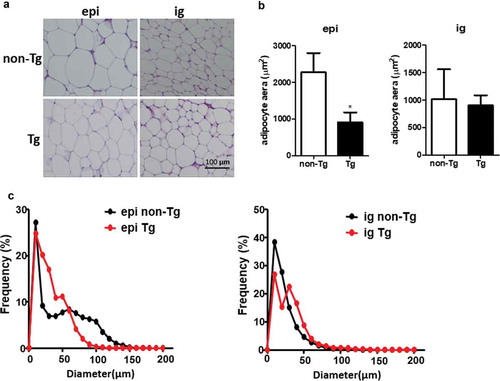
Figure 5. Effect of SFRP4 on gene expression in visceral adipose tissue. (a) The expression of adipogenic genes in epi WAT was determined by qPCR. (b) adipokine protein expression was determined by western blotting. Data are expressed as mean ± SEM, n = 6. **P < 0.01, ***P < 0.001 vs. non-Tg
Figure 6. Effect of SFRP4 on gene expression in subcutaneous adipose tissue. (a) The expression of adipogenic genes in ig WAT was determined by qPCR. (b) Adipokine protein expression was determined by western blotting. Data are expressed as mean ± SEM, n = 6. *P < 0.05, **P < 0.01 vs. non-Tg