
Figures & data
Table 1. Anthropometric measurements and clinical variables of IGR participants before and after the intervention
Figure 1. (a) MicroRNAs expression in serum of IGR individuals (n = 20) at baseline and 6 months after the lifestyle intervention. Data were analysed by Paired T-test and are expressed as Mean ± SD (p ≤ 0.025). (b) MicroRNAs expression in serum of IGR individuals which maintained weight or lost 3% of weight only (n = 17) at baseline and 6 months after the lifestyle intervention. Data were analysed by Paired T-test and are expressed as Mean ± SD (p ≤ 0.025)
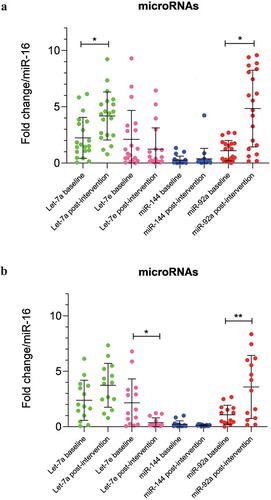
Figure 2. (a) Correlation matrix among microRNAs and clinical variables in all IGR individuals at baseline. Analysis were done by Pearson’s correlation, p ≤ 0.05. The r values for each correlation are shown in the squares. (b) Correlation matrix among microRNAs and clinical variables in all IGR individuals post-intervention. Analysis were done by Pearson’s correlation, p ≤ 0.05. The r values for each correlation are shown in the squares
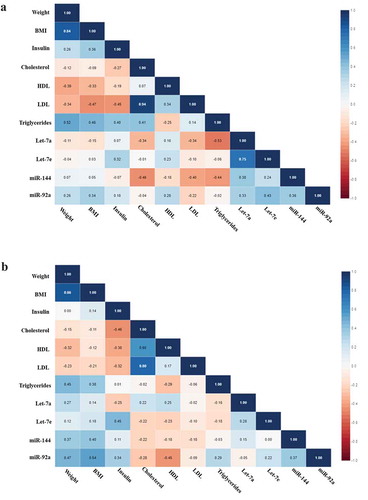
Figure 3. (a) Correlation matrix among microRNAs and clinical variables in IGR individuals who maintained or lost 3% in weight or more at baseline. Analysis were done by Pearson’s correlation, p ≤ 0.05. The r values for each correlation are shown in the squares. (b) Correlation matrix among microRNAs and clinical variables in IGR individuals who maintained or lost 3% in weight or more post-intervention. Analysis were done by Pearson’s correlation, p ≤ 0.05. The r values for each correlation are shown in the squares
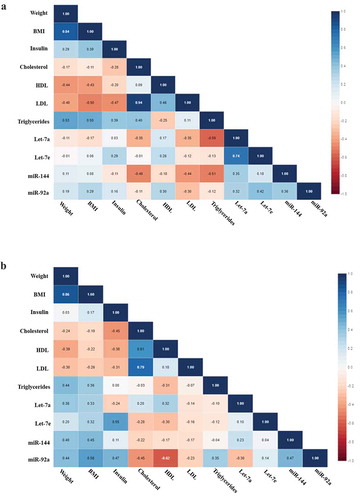
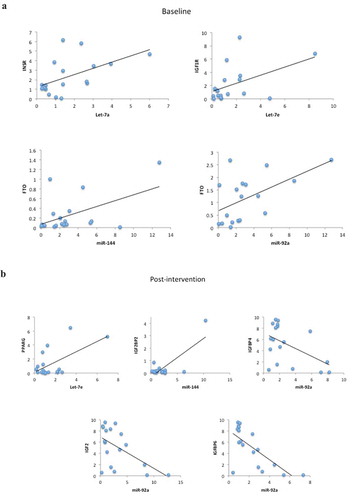
Figure 4. (a) Scatter plots representing the correlations among microRNAs and target genes in all IGR individuals at baseline. Analysis were done by Pearson’s correlation, p ≤ 0.05, r ≥ 0.350. (b) Scatter plots representing the correlations among microRNAs and target genes in all IGR individuals post-intervention. Analysis were done by Pearson’s correlation, p ≤ 0.05 r ≥ 0.350
Data availability statement
Data available on request due to privacy/ethical restrictions