Figures & data
Table 1. List of primary antibodies and conditions of use
Table 2. List of primers used to quantitate the mRNA levels of markers of differentiation.
Figure 1. Dose Dependent Effect of Zyflamend on 3T3-MBX adipocyte differentiation. (a) An overview of the experimental design and the differentiation procedure. 3T3-MBX were differentiated in the presence of increasing doses of Zyflamend for 12 days. Cells were fixed and stained with Oil Red O. (b) Oil Red O staining of non-differentiated (ND; Day 1 of differentiation), fully differentiated adipocytes (0 μg/ml; day 12 of differentiation), and cells treated with the indicated concentrations of Zyflamend for 12 days. (c) Oil Red O stain was extracted, and its absorbance (520 nm) was quantitated. Bar graph represents data from six independent experiments, and are expressed as mean + SEM. *p < 0.05, **p < 0.01 indicate significant difference between non-treated and Zyflamend-treated cells
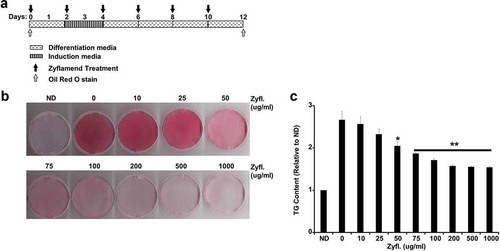
Figure 2. A physiologically relevant dose of Zyflamend inhibits 3T3-MBX adipocyte differentiation. (a) An overview of the experimental design and the differentiation procedure. (b) 3T3-MBX pre-adipocytes were treated with DMSO or 200 μg/ml of Zyflamend and differentiated, as described in the methods section. Freshly prepared solutions of DMSO and Zyflamend were added at each change of media. At different days of differentiation, cells were fixed and stained with Oil Red O, then the dye was extracted, and its absorbance (520 nm) quantitated (c). Bar graph represents data from six independent experiments, and are expressed as mean + SEM. *p < 0.05, **p < 0.01 indicate significant difference between the indicated time and day one of differentiation. †p < 0.05, ††p < 0.01 indicate significant difference between Zyflamend and control (DMSO) treated cells. (d) Phase contrast images of non-differentiated (Day 1), fully differentiated adipocytes (Day 12), and cells treated with Zyflamend (200 μg/ml) for 12 days. Scale bar: 100 μm. Images in the far right panels are a zoomed capture of the boxed areas on Day 12 of differentiation
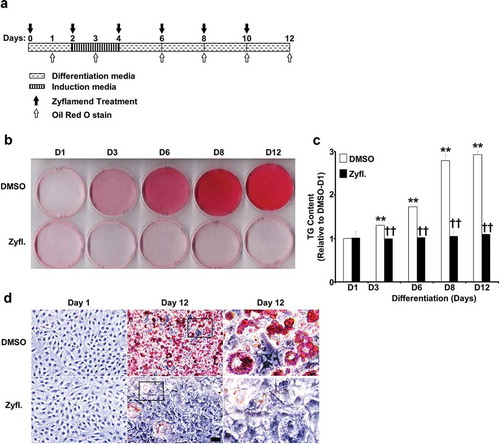
Figure 3. A physiologically relevant dose of Zyflamend causes cell cycle arrest and induces apoptosis in 3T3-MBX pre-adipocytes. (a) 3T3-MBX pre-adipocytes were treated with DMSO or 200 μg/ml of Zyflamend for the indicated time. Zyflamend toxicity and cell proliferation were assessed using the SRB cytotoxicity assay as detailed in the method section. Bar graphs represent the intensity of SRB staining reflective of the cell number and presented as means + SEM. *p < 0.05, **p < 0.01 indicate significant difference between cell survival rate at the indicated time point and 12 hr. †p < 0.05, ††p < 0.01 indicate significant difference between non-treated and Zyflamend-treated cells. (b) 50% confluent cells were treated with increasing concentrations of Zyflamend, and then labelled with Annexin V-FITC and 7-AAD. Representative dot plots are shown. Annexin V positive and 7-AAD negative cells (lower right quadrants) represent early stages of apoptosis. Whereas cells that are positive for both annexin V and 7-AAD (upper right quadrants) are in the late stages of apoptosis. (c) Bar graphs represent live, early, and late apoptotic cells are presented as means + SEM of at least three independent experiments. *p < 0.05, **p < 0.01 indicate significant difference between the indicated concentration and control cells treated with the vehicle DMSO
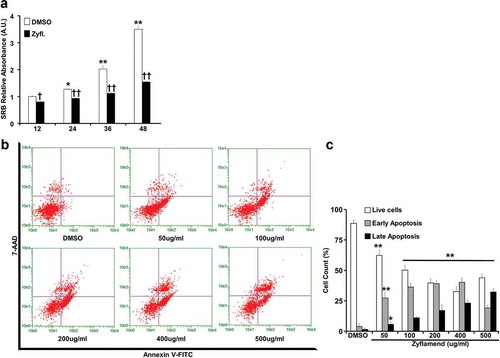
Figure 4. Zyflamend alters the expression of adipogenic markers during the differentiation of 3T3-MBX adipocytes. (a) Immunoblots of adipogenic markers in 3T3-MBX cells treated or non-treated with Zyflamend (200 μg/ml) at varying stages of differentiation. Lysates were blotted for β-actin to control for loading. Representative immunoblots from three independent experiments are shown. (b) Bar graphs represent the indicated protein normalized to β-Actin as means + SEM. *p < 0.05, **p < 0.01 indicate significant difference between the indicated time points and day 1 for each cell type. †p < 0.05, ††p < 0.01 indicate significant difference between Zyflamend and control (DMSO) treated cells. (c) Quantitative (q)RT-PCR of Fasn, Dlk1, Retn, Fabp4, Adipq, and Cebpa mRNA levels in control and Zyflamend-treated (200 μg/ml) cells at various days of differentiation. Data are normalized to 18S ribosomal RNA (18S rRNA). Results are representative of three independent experiments and data are expressed as mean + SEM. *p < 0.05, **p < 0.01 indicate significant difference between indicated time points and day 1 for each treatment. †p < 0.05, ††p < 0.01 indicate significant difference between Zyflamend and control (DMSO) treated cells
Figure 5. Zyflamend inhibits lipogenesis and induces lipolysis in fully differentiated 3T3-MBX adipocytes. Total lysates from fully differentiated 3T3-MBX adipocytes treated with the indicated concentrations of Zyflamend for 24 hr were immunoblotted for markers of lipogenesis (a-b) and lipolysis (c-d). Representative immunoblots from three independent experiments are shown. (b-d) Bar graphs represent pAMPKT172/AMPK, FASN/β-Actin, pACCS79/ACC, pHSLS660/HSL, and HSL/β-Actin as means + SEM. *p < 0.05, **p < 0.01 indicate significant difference between the indicated concentration of Zyflamend and control untreated cells
Figure 6. Zyflamend activates PKA signalling pathway in differentiating 3T3-MBX adipocytes. (a-b) Total cell lysates from control and Zyflamend treated cells for the entire duration of differentiation were immunoblotted for phosphorylated P38, JNK, c-JUN, their respective unphosphorylated proteins, c-FOS, and β-Actin to control for loading. (a) Representative immunoblots from three independent experiments are shown. (b) Bar graphs represent pP38T180/Y182/P38, pJNKT183/Y185/JNK, pc-JUNS63/c-JUN, and c-FOS/β-Actin as means + SEM. p < 0.05, **p < 0.01 indicate significant difference between indicated time points and day 1 for each treatment. †p < 0.05, ††p < 0.01 indicate significant difference between Zyflamend and control (DMSO) treated cells. (c) Immunoblots of phosphorylated PKA substrate in 3T3-MBX cells treated or non-treated with Zyflamend (200 μg/ml) for the entire duration of differentiation. Representative immunoblots from three independent experiments are shown. (d) Bar graphs represent phosphorylated PKA substrate/β-Actin as means + SEM. *p < 0.05, **p < 0.01 indicate significant difference between indicated time points and day 1 for each treatment. †p < 0.05, ††p < 0.01 indicate significant difference between Zyflamend and control (DMSO) treated cells. (e) Immunoblots of pHSLS660, and HSL in 3T3-MBX cells treated or non-treated with Zyflamend (200 μg/ml) for the entire duration of differentiation. Representative Immunoblots from three independent experiments are shown. (f) Bar graphs represent pHSLS660/HSL, and HSL/β-Actin as means + SEM. *p < 0.05, **p < 0.01 indicate significant difference between the indicated time points and day 1 for each treatment. †p < 0.05, ††p < 0.01 indicate significant difference between Zyflamend and control (DMSO) treated cells
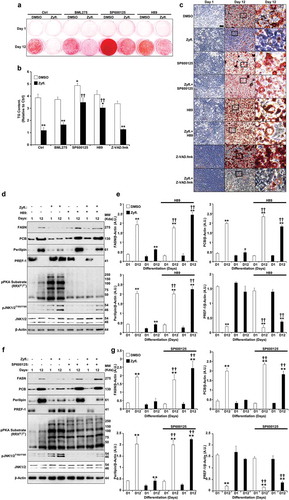
Figure 7. Inhibition of PKA and JNK abrogates the effects of Zyflamend on differentiation (a-b) Oil Red O-stained images of non-differentiated (Day 1) and differentiated adipocytes (Day 12) treated or non-treated with AMPK (BML275), JNK (SP600125), PKA (H89) or apoptosis (Z-VAD.fmk) inhibitors for the entire duration of differentiation. (b) Oil Red O stain was extracted, and its absorbance (520 nm) was quantitated. Bar graph represents data from at least six independent experiments, and data are expressed as mean + SEM. *p < 0.05, **p < 0.01 indicate significant difference between non-treated and Zyflamend-treated cells. †p < 0.05, ††p < 0.01 indicate significant difference between cells treated with the indicated inhibitor together with Zyflamend and cells treated with Zyflamend only. (c) Phase contrast images of non-differentiated (Day 1) and differentiated adipocytes (Day 12) treated or non-treated with Zyflamend, SP600125, H89, or Z-VAD.fmk (alone or in combination with Zyflamend). Images in the far right panels are a zoomed capture of the boxed areas on Day 12 of differentiation. Scale bar: 100 μm. (d-g) Immunoblots of adipogenic markers in 3T3-MBX cells treated or non-treated with Zyflamend (200 μg/ml) with or without PKA inhibitor (H89; d-e) or JNK inhibitor (SP600125; f-g). Lysates were blotted for β-actin to control for loading. Representative Immunoblots from three independent experiments are shown. e-g) Bar graphs represent the indicated protein normalized to β-Actin as means + SEM. *p < 0.05, **p < 0.01 indicate significant difference between day 1 and day 12 of differentiation for each treatment. †p < 0.05, ††p < 0.01 indicate significant difference between inhibitor-treated and non-treated cells
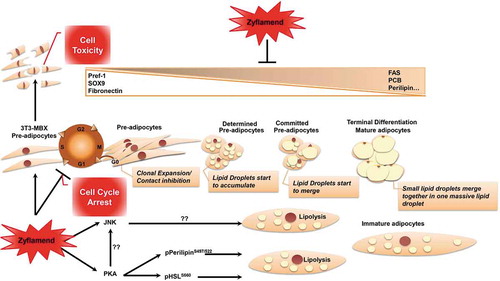
Schematic 1 Overview of Zyflamend’s effects on adipocyte differentiation, lipolysis, and adipogenesis