Figures & data
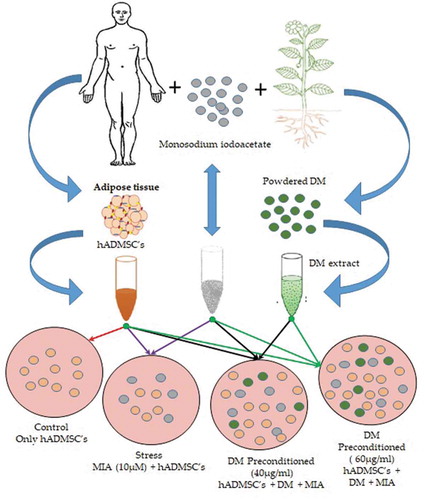
Table 1. List of primers used in the present study
Figure 1. FACS analysis of hADMSCs for expression of CD105, CD90, CD73, CD45, CD106, CD49d and CD34 cell surface markers
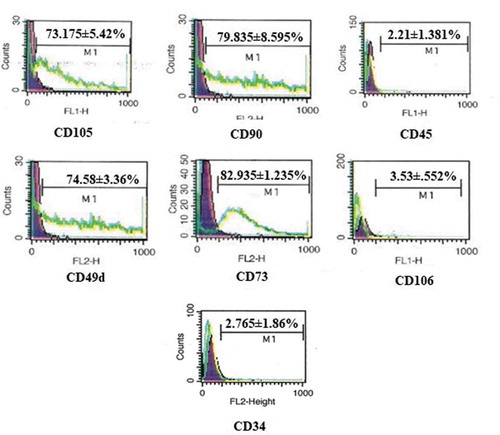
Figure 2. Metabolic activity and viability of hADMSCs in response to MIA stress and DM preconditioning. A. Metabolic activity of hADMSCs preconditioned with different doses of DM extract. B. hADMSCs viability against different DM concentrations. C. Metabolic activity of hADMSC’s preconditioned with DM extract concentrations followed by MIA induced oxidative stress. D. Percent viability of hADMSC’s after DM preconditioning and MIA induced oxidative stress. Values are statistically significant at p*<0.05, p*< 0.01 compared with the stress group. E. Graph representing metabolic activity response of hADMSC’s against monosodium iodoactate induced oxidative stress. The experiment was carried out in triplicates (n = 3)
Figure 3. Migration potential of hADMSCs where (a) represents DM Preconditioned hADMSCs at concentrations of DM 40 µg/ml and DM 60 µg/ml shows an increased wound closure potential as compared to control group while (b) represents the statistical analysis of wound closure at day 0, day1, day2 and day 3 performed through ‘imagej’ software. Wound closure was evaluated as area covered by cells in millimetre (mm) of scratched area. DM-40 and DM 60 represents doses at 40 µg/ml and 60 µg/ml respectively
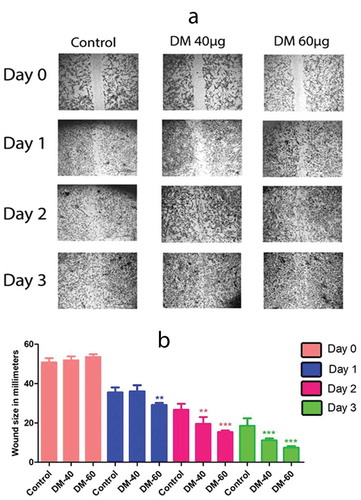
Figure 4. Biochemical assays of cells preconditioned with DM extract at 40 µg/ml and 60 µg/ml concentrations. LDH activity of DM preconditioned and MIA induced hADMSCs (a), Superoxide Dismutase activity of hADMSCs (b) and activity of reactive oxygen species within hADMSCS (c)
Figure 5. The mRNA expression level of proinflammatory markers where, (a) represents expression levels of TNF-α, (b) indicates mRNA levels of p65, (c) reveals the expression levels of p50, (d) fold change of MMP-13 and (e) indicates the expression level of IL1β
Figure 6. Cytokine concentrations (n = 3) of control, stress and DM preconditioned groups where (a) represents protein concentration of TNF-α (b) represents protein concentration of p65 while (c) indicates the protein concentrations of IL1β while (d) represents the protein concentrations IKK-α and IKK-β