Figures & data
Figure 1. Loss of adipocyte ADAM17 does not have a baseline phenotype. (a) qRT-PCR measurement of relative Adam17 Exon 2 expression relative Tbp. Body composition analysis of 14-week old male (b) and female (c) mice. (d) IPGTT on 14-week old male mice. (e) Statistical analysis of area under the curve (AUC) from (D). (f) IPGTT on 14-week old female mice. (g) Statistical analysis of AUC from (F). 10X (h) and 20X (i) H&E histology of indicated adipose tissue, scale bar indicated on figure. Unpaired student’s t-test (B, C, E, F). Data presented are from one experiment but representative of three independent experiments (B, C, E, F, mean ± SEM). n = 8–18 for each group for IPGTT experiments. n = 4–6 for each group for body composition experiments
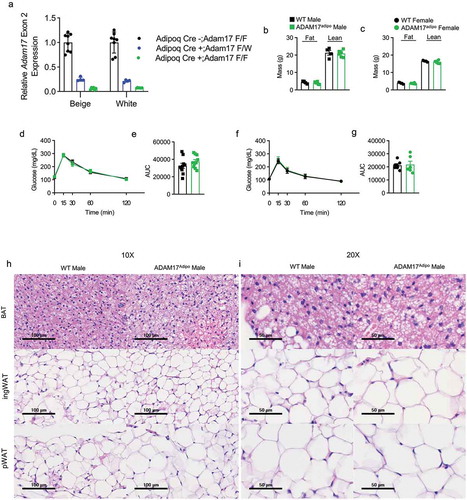
Figure 2. Loss of adipocyte ADAM17 does not affect whole-body metabolic phenotype in male mice. 14-week old male mice were subjected to whole-body metabolic phenotyping using the TSE PhenoMaster system. Total energy expenditure (a-b), oxygen consumption (c-d), CO2 production (e-f), locomotor activity (g-h), caloric intake (i-j) and respiratory exchange ratio (k) were all measured for 72 h Generalized linear regression modelling with regression analysis for body weight (B, D, F, H, J, K). Data presented are from one independent experiment (A – K, mean ± SEM). n = 5–7 mice per genotype
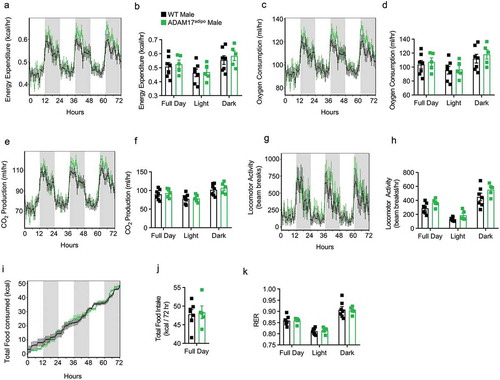
Figure 3. Loss of adipocyte ADAM17 does not affect responsiveness to HFD. (a) Male mice were placed on HFD for 11 weeks and weights were measured weekly. (b) Statistical analysis of AUC from A. (c) Female mice were placed on HFD for 11 weeks and weights were measured weekly. (d) Statistical analysis of AUC from C. Body composition analysis of male (e) and female (f) mice after 14 weeks of HFD diet. (g) IPGTT on male mice following 12 weeks of HFD. (h) Statistical analysis of AUC from G. (i) IPGTT on female mice following 12 weeks of HFD. (j) Statistical analysis of AUC from I. (k) Adipose tissue gene panel from RNA-seq data showing fold change relative to WT for male mice. (l) Inflammatory gene panel from RNA-seq data showing fold change relative to WT for male mice. 10X (m) and 20X (n) H&E histology of indicated adipose tissue, scale bar is indicated on figure. Unpaired Student’s t-test (B, D, E, F, H, J). Data presented are from one experiment but representative of three (a – j) and one (k – l) independent experiments (A-L, mean ± SEM). n = 9–15 for each group for IPGTT experiments. n = 2–8 for each group for body composition experiments. n = 3 for each group for RNA-seq experiments
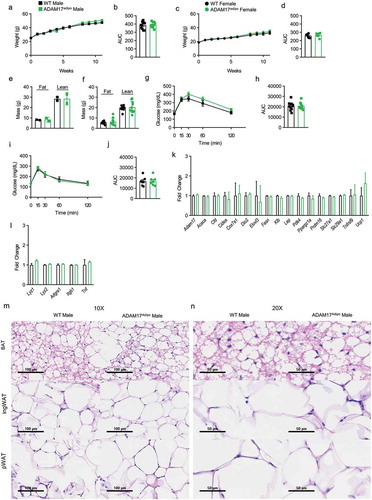
Figure 4. Loss of adipocyte ADAM17 does not affect whole-body metabolic phenotype in male mice following HFD. Following 12 weeks of HFD, male mice were subjected to whole-body metabolic phenotyping using the TSE PhenoMaster system. Total energy expenditure (a-b), oxygen consumptions (c-d), CO2 production (e-f), locomotor activity (g-h), caloric intake (i-j) and respiratory exchange ratio (k) were all measured for 72 h. Generalized linear regression modelling with regression analysis for body weight (B, D, F, H, J, K). Data presented are from one independent experiment (A – K, mean ± SEM). n = 5–7 mice per genotype
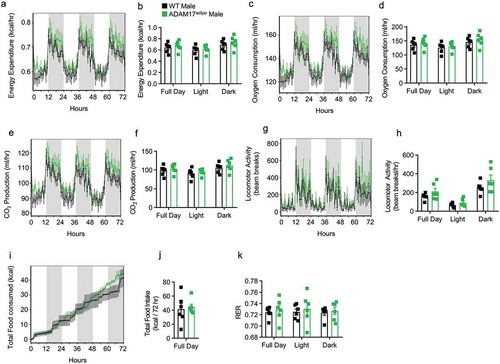
Figure 5. Loss of adipocyte ADAM17 has a small effect on macrophage inflammation following HFD. (a) tSNE analysis pre-gated on CD45+ leukocytes in the pWAT following 12 weeks of HFD. (b) Total number of CD45+ leukocytes per gram of pWAT tissue following 12 weeks of HFD. (c) Representative pseudocolor flow cytometry plots pre-gated on CD45+ live cells gated for macrophages. (d) Statistical analysis of the total number of macrophages per gram of pWAT tissue following 12 weeks of HFD gated from C. (e) Representative pseudocolor flow cytometry plots for intracellular cytokine staining for IL-6 pregated on macrophages following 12 weeks of HFD. Statistical analysis of the relative (f) and absolute (g) number of IL-6+ macrophages as gated in E. (h) Representative pseudocolor flow cytometry plots for intracellular cytokine staining for TNF pregated on macrophages following 12 weeks of HFD. Statistical analysis of the relative (i) and absolute (j) number of TNF+ macrophages as gated in H. (k) Representative pseudocolor flow cytometry plots for intracellular cytokine staining for RELMa pregated on macrophages following 12 weeks of HFD. Statistical analysis of the relative (l) and absolute (m) number of RELMa+ macrophages as gated in K. Statistical analysis of surface CD80 MFI on macrophages following 12 weeks of HFD. – one-way ANOVA with Tukey’s post-test (A, D, F, G, I, J, L, L, N). Data presented are from one experiment but representative of three independent experiments (A, D, F, G, I, J, L, M, N, mean ± SEM). n = 9–15 for each group

Figure 6. Loss of adipocyte ADAM17 does not affect T cell responses following HFD. (a) Representative pseudocolor flow cytometry plots pre-gated on CD3+ T cells. Statistical analysis of the absolute number of ɑβ (b) and ɣδ (c) T cells per gram of pWAT tissue following 12 weeks of HFD gated from A. (d) Representative pseudocolor flow cytometry plots pre-gated on TCRβ+ T cells. (e) Statistical analysis of the absolute number of CD4+ (E) and CD8+ (f) T cells per gram of pWAT tissue following 12 weeks of HFD gated from D. (g) Representative pseudocolor flow cytometry plots pre-gated on CD4+ T cells showing ST2 expression. Statistical analysis of the relative (h) and absolute (i) number of ST2+ CD4+ T cells following 12 weeks of HFD. Percentage of CD4+ (j), CD8+ (k) and γδ (l) T cells producing indicated cytokines. one-way ANOVA with Tukey’s post-test (B, C, E, F, H – L). Data presented are from one experiment but representative of three independent experiments (B, C, E, F, H – L, mean ± SEM). n = 9–15 for each group
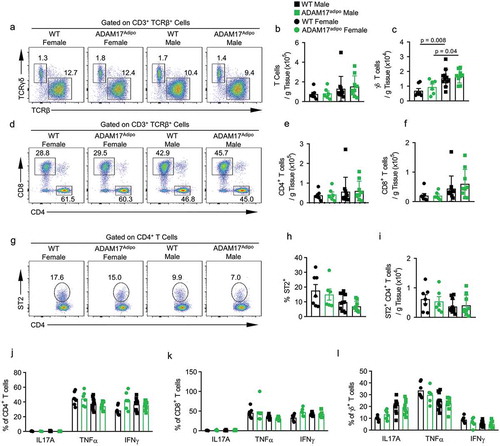
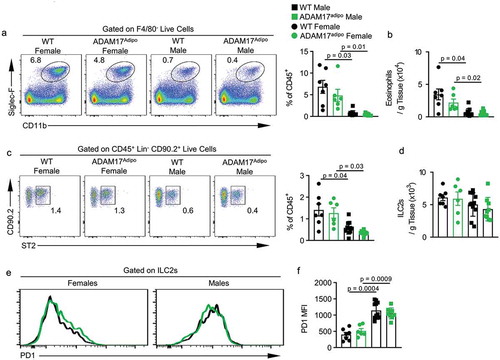
Figure 7. Th2 environment is altered in ADAM17adipo mice following HFD. (a) Representative pseudocolor flow cytometry plots pre-gated on F4/80− live cells. (b) Statistical analysis of the absolute number of eosinophils per gram of pWAT tissue following 12 weeks of HFD gated from A. (c) Representative pseudocolor flow cytometry plots pre-gated on Lin− CD90.2+ live cells. (d) Statistical analysis of absolute numbers of ILC2s per gram of pWAT tissue following 12 weeks of HFD gated from C. (e) Representative histograms of PD1 expression on ILC2s from male and female mice following HFD. (f) Statistical analysis of PD1 MFI on ILC2s., one-way ANOVA with Tukey’s post-test (B, D, F). Data presented are from one experiment but representative of three independent experiments (B, D, F, mean ± SEM). n = 9–15 for each group