Figures & data
Figure 1. UA induced the expression of Il6 and chemokine genes in cultured adipocytes. (a) 3T3-L1 adipocytes were treated with vehicle, 10 µM, 25 µM or 50 µM UA for 12 h. Gene expression levels of Il6, Tnfa, Mcp1, Mcp3 and Mip2 in the cells were analysed. (b) 3T3-L1 adipocytes were treated with vehicle or 25 µM UA for the indicated time. Gene expression levels of Il6, Tnfa, Mcp1, Mcp3 and Mip2 in the cells were detected. (c) 3T3-L1 adipocytes were treated with vehicle or 25 µM UA for 12 h, concentrations of IL6 and MCP1 in the cell culture medium were measured. N = 3 per group. P values in the bar graph represent the results of one-way ANOVA analysis. Different letters of a, b and c on the bars indicate significant difference among the groups. Results represented one of three independently performed experiments
Figure 2. UA promoted the expression of interleukin and chemokine genes in the adipose tissue of DIO mice. DIO mice were treated with UA or vehicle for 3 d. (a) Il6, Il1b and Tnfa expression levels in gonadal fat tissues. (b) Mcp1, Mcp3 and Mip2 expression levels in gonadal fat tissues. (c) Concentrations of IL6, TNFα and MCP1 in mouse serum. N = 5 mice per group. P values in the bar graph represent the results of one-way ANOVA analysis. Different letters of a and b on the bars indicate significant difference among the groups

Figure 3. UA induced the expression of interleukin and chemokine genes in the adipose tissue of lean mice. Normal chow fed mice were treated with UA (n = 6) or vehicle (n = 7) for 3 d. (a) Gene expression levels Il6, Il1b and Tnfa in gonadal fat tissues. (b) Mcp1, Mcp3 and Mip2 expression levels in gonadal fat tissues. (c) Serum levels of IL6. (d) Serum levels of MCP1. *P < 0.05, **P < 0.01 Veh VS UA
Figure 4. UA suppressed lipogenic gene expression in adipocytes. 3T3-L1 adipocytes were treated with vehicle, 10 µM, 25 µM or 50 µM UA for 12 h. (a) Gene expression levels of Acc1, Fasn and Srebp1c. (b) ACC1 protein levels in the cells. (c) Gene expression levels of Foxo1. P values in the bar graph represent the results of one-way ANOVA analysis. Different letters of a, b and c on the bars indicate significant difference among the groups. N = 3 per group. Results represented one of three independently performed experiments
Figure 5. UA stimulated white adipose tissue to recruit CD14+ monocytes. Normal chow fed male mice were treated with UA (n = 6) or vehicle (n = 7) for 3 d. (a) Gene expression levels of F4/80, Cd11 c, Cd14, Cd4, Cd3e, Cd8b1, Ccr6, Ly6g and Cd11b in gonadal fat tissues. (b) H&E staining images for gonadal fat tissues. Red arrows indicate crown-like structures. (c) Images for CD14 immunohistochemical stain of gonadal fat tissues. Red arrows indicate CD14 positive monocytes. (d) Average numbers of CD14 positive monocytes per images. *P < 0.05 Veh VS UA
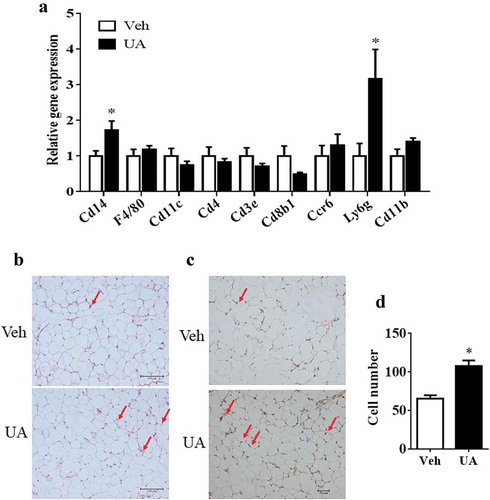
Figure 6. UA administration trended to impair glucose tolerance test in DIO mice. Diet-induced obese mice were daily injected with UA or vehicle for 3 d (n = 7 per group). Glucose tolerance test (a) was performed on day 4, and insulin tolerance test (b) was performed on day 7 of UA treatment. P values in the bar graph represent the results of repeated-measures ANOVA analysis
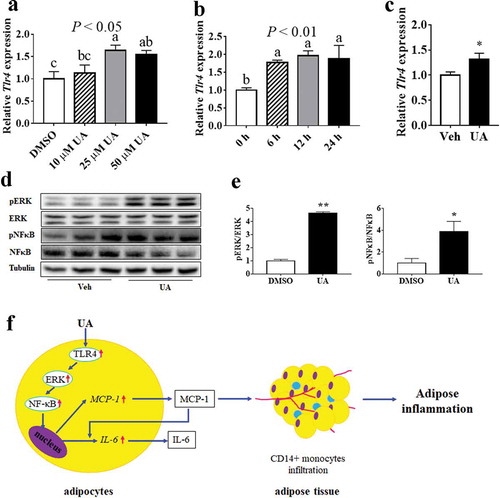
Figure 7. UA upregulated the expression of Tlr4 and the phosphorylation levels of ERK and NFκB. (a) Tlr4 expression levels in 3T3-L1 adipocytes which were treated with vehicle, 10 µM, 25 µM or 50 µM UA for 12 h (n = 3 per group). (b) Tlr4 expression levels in 3T3-L1 adipocytes which were treated with 25 µM UA or vehicle for the indicated time (n = 3 per group). (c) Tlr4 expression levels in the gonadal adipose tissue of lean mice which were treated with vehicle or UA (n = 6–7 per group). (d,e) Phosphorylation levels of ERK and NFκB in the 3T3-L1 adipocytes which were treated with 25 µM UA or vehicle for 30 min (n = 3 per group). (f) Illustration for UA stimulating adipose tissue to recruit CD14+ monocytes. *P < 0.05, **P < 0.01 Veh VS UA. P values in the bar graph represent the results of one-way ANOVA analysis. Different letters of a, b and c on the bars indicate significant difference among the groups. Results for cell studies represented one of three independently performed experiments