
Figures & data
Figure 1. Screenshots of adipocyte tissue images pre- and post-analysis
Each method successfully segmented adipocytes and calculated their areas, which are shown in yellow outlines (micrograph), blue outlines (QuPath), or as solid orange (Visiopharm). Magnification: Micrograph 4x, QuPath 5x, Visiopharm 5x. Insets: whole-slide subgross images when applicable.
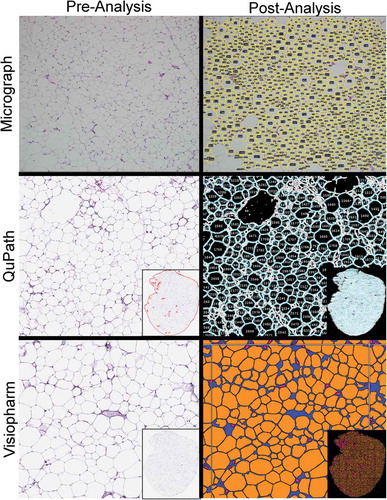
Table 1. Number and average area of individual adipocytes by method
Figure 2. Population-level representations of adipocyte size
Histograms with absolute numbers of adipocytes of a given size were sorted by area with bin size of 500 µm2 (a, c). Relative frequency plots: the number of counted cells of a given size per bin (size = 500 µm2) was normalized to the total number of cells counted per slide to generate a percentage (b, d). Slides from Chow-fed mice (n = 7) are shown in A and B, while slides from HFD-fed mice (n = 8) are shown in C and D.
Figure 3. Pairwise representations between image analysis methods
Bland-Altman plots of micrograph and QuPath (a), micrograph and Visiopharm (c) and QuPath and Visiopharm (e) emphasize the greater difference in method results between micrograph and whole-slide image analysis. Regression plots indicate a weak correlation between QuPath and micrograph methods (b), a weak but greater correlation between Visiopharm and micrograph methods (d) and a strong correlation between Visiopharm and QuPath, the two whole-slide image analysis methods (f).
Supplemental material