Figures & data

Figure 1. Exercise induces DEL-1 gene expression in human skeletal muscle. (a) Gene expression (TPM; transcripts per million) in resting and exercise for 15 min using RNAseq analysis. (b) gene expression of pre-exercise, 3 h post-exercise and 48 h post-exercise using microarray analysis. Gene expression of normal and obese (c)/diabetic (d) pre-exercise using microarray analysis. (e) gene expression of obese pre-exercise, 6 h post-exercise and 24 h post-exercise using microarray analysis. (f) gene expression of diabetic pre-exercise, 0 h post-exercise and 3 h post-exercise using microarray analysis. ***P < 0.001 and *P < 0.05, when compared to DEL-1 gene expression in control. !!!P < 0.001, when compared to 3 h post-exercise
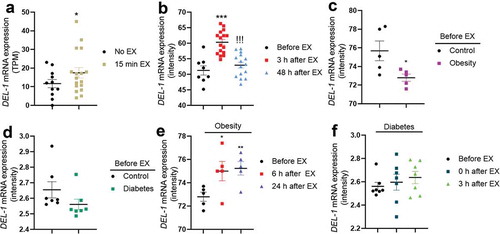
Figure 2. DEL-1 ameliorates palmitate-induced inflammation and insulin resistance in 3T3-L1 adipocytes. (a) Western blot analysis of NFκB and IκB phosphorylation in differentiated 3T3-L1 cells treated with palmitate (200 μM) and DEL-1 (0–1 μg/mL) for 24 h. (b) Western blot analysis of IRS-1 and Akt phosphorylation in differentiated 3T3-L1 cells treated with palmitate (200 μM) and DEL-1 (0–1 μg/mL) for 24 h. Human Insulin (10 nM) stimulates IRS-1 and Akt phosphorylation for 3 min. Means ± SEM were obtained from three independent experiments. ***P < 0.001 and **P < 0.01 when compared to control or insulin treatment. !!!P < 0.001 and !P < 0.05 when compared to palmitate or insulin plus palmitate treatment
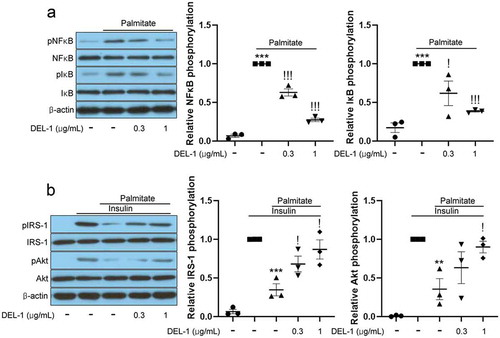
Figure 3. AMPK/HO-1 contributes to the attenuation of inflammation and insulin resistance in 3T3-L1 adipocytes. (a) Western blot analysis of AMPK phosphorylation and HO-1 expression in differentiated 3T3-L1 cells treated with DEL-1 (0–1 μg/mL) for 24 h. (b) Western blot analysis of AMPK phosphorylation and HO-1 expression in AMPK or HO-1 siRNA-transfected 3T3-L1 adipocytes treated with DEL-1 (1 μg/mL) for 24 h. Western blot analysis of NFκB and IκB phosphorylation in AMPK (c) or HO-1 (d) siRNA-transfected 3T3-L1 myocytes treated with palmitate (200 μM) and DEL-1 (1 μg/mL) for 24 h. (e) ELISA for TNFα and MCP-1 release by AMPK or HO-1 siRNA-transfected 3T3-L1 adipocytes treated with DEL-1 (1 μg/mL) for 24 h. Western blot analysis of phosphorylation of IRS-1 and Akt and glucose uptake measurement (f) in AMPK or HO-1 siRNA-transfected 3T3-L1 adipocytes treated with 200 μM palmitate and DEL-1 (1 μg/mL) for 24 h. Human insulin (10 nM) stimulates insulin signalling for 3 min. Means ± SEM were obtained from three independent experiments. ***P < 0.001 when compared to control or insulin treatment. !!!P < 0.001, !!P < 0.01 and !P < 0.05 when compared to palmitate or insulin plus palmitate treatment. ###P < 0.001, ##P < 0.01 and #P < 0.05 when compared to the insulin, palmitate plus DEL-1 or insulin, palmitate plus DEL-1 treatment
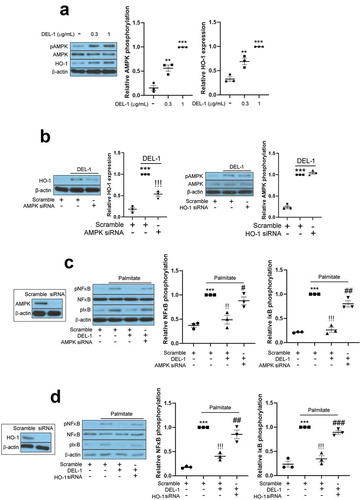
Figure 3. (Continued)
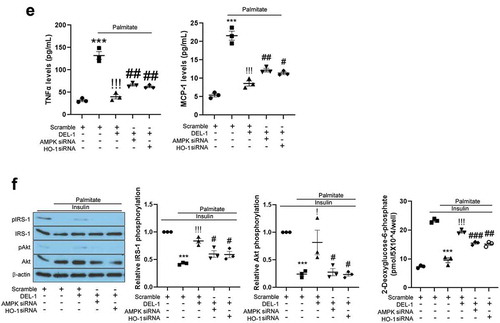
Figure 4. DEL-1 did not affect 3T3-L1 differentiation. (a) Oil-red O staining in differentiated 3T3-L1 cells in the presence of DEL-1 (0–1 μg/mL) for 6 d. TG accumulation was quantitated by modified TG assay kit. (b) Western blot analysis of processed SREBP1 and SCD1 expression in 3T3-L1 adipocytes treated with DEL-1 (0–1 μg/mL) for 6 d. (c) Western blot analysis of UCP-1 and PGC-1α expression in AMPK siRNA-transfected 3T3-L1 adipocytes treated with DEL-1 (0–1 μg/mL) for 24 h. Means ± SEM were obtained from three independent experiments. ***P < 0.001 and **P < 0.01 when compared to control. !P < 0.05 when compared to DEL-1 (1 μg/mL) treatment
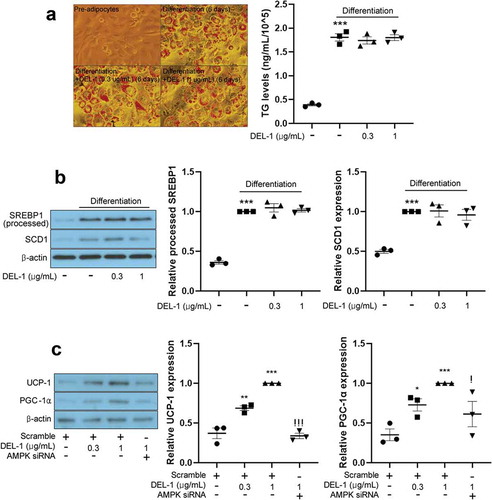
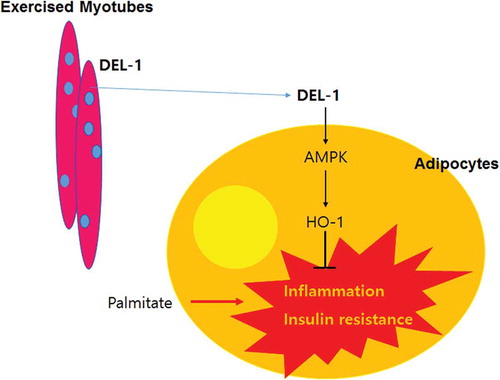
Figure 5. Schematic diagram for the effects of DEL-1 on inflammation and insulin resistance in adipocytes