Figures & data
Figure 1. Overview of the experimental design of CRISPR/Cas9 experiments and proof of principle. (a) Work flow depicting all steps from CRISPR/Cas9 target sequence selection to downstream analysis and approximated time frame. (b) Partial sequence of the human SPRY1 gene (123401618–123402790 Homo sapiens chromosome 4). Only the forward strand is shown. CRISPR/Cas9 target sequences are labelled in grey (#1: dark grey; #2: light grey). PAM sequences are depicted in bold letters. Note: the PAM sequence required for target #2 is located on the complementary strand. ‘<>’ indicates the Streptococcus pyogenes CRISPR/Cas9 cleavage site 3bp upstream of the corresponding PAM sequence. Primer sites for PCR amplification of target sites are shown in black. (c) Determination of the CRISPR/Cas9-GFP KO efficiency in U2OS cells stably expressing a GFP-LC3 fusion protein (U2OS-GFP-LC3) by FACS analysis. Intensity of GFP fluorescence was measured as readout. Left panel: FACS histogram of parental untransfected U2OS cells (no GFP expression). Middle panel: FACS histogram of U2OS-GFP-LC3 cells transfected with 8 μg DNA of a non-GFP targeting CRISPR/Cas9 plasmid (negative control) after Puromycin selection. Right panel: FACS histogram of U2OS-GFP-LC3 cells transfected with 8 μg DNA of the pLentiCRISPR.v2-GFP expression vector after Puromycin selection
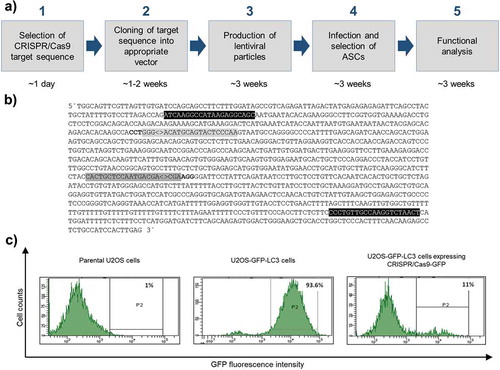
Table 1. Average virus titre of n = 3 different charges. No statistically significant differences were observed between groups (Two-way Unpaired t-test). TU: transforming units
Figure 2. PCR-based analysis of SPRY1 gene mutations. (a) PCR-based mutation detection assay according to the protocol provided by the Guide-it Mutation Detection Kit from Takara Bio Inc. (USA): The genomic region covering the expected CRISPR/Cas9-mediated mutations within the SPRY1 gene was PCR-amplified (see, )) in CRISPR/Cas9-GFP (GFP), CRISPR/Cas9-SPRY1 #1 (#1) and CRISPR/Cas9-SPRY1 #2 (#2) expressing ASCs. The PCR product (972bp) obtained from each cell population was melted and re-hybridized. This step results in the formation of DNA heteroduplexes originating from wildtype and mutated cells. Subsequently, mismatched DNA strands were cleaved by Resolvase and analysed by agarose gel electrophoreses. Predicted cleavage products are indicated by arrows. CRISPR/Cas9 efficiency was calculated as described in the methods section. N. d.: not determined; (b) Tracking of indels by decomposition (TIDE). The PCR product obtained in a was purified and Sanger sequenced using the forward primer. Distribution of indels within the targeted SPRY1 gene locus was calculated using the TIDE algorithm as described in the methods section. A representative result of n = 4 donors is shown
Figure 3. Effects of CRISPR/Cas9-SPRY1 and shSPRY1 on SPRY1 mRNA and protein levels. RT-qPCR analysis of SPRY1 mRNA levels in (a) CRISPR/Cas9 expressing ASCs and (b) ASCs transduced with appropriate shRNA constructs. Values are presented as mean ± SEM of n = 3 replicates. Statistical comparison was achieved using the Two-tailed paired t-test. (c) Western blot analysis corresponding to the results shown in A) and B). β-Actin served as loading control. (d and e): Densitometric analysis of the Western blot shown in C). Values are presented as mean ± SEM of n = 3 replicates. Statistical comparison was achieved using the Two-tailed paired t-test. Data obtained in CRISPR/Cas9 ASCs correspond to the results presented in . A representative result of n = 4 donors is shown
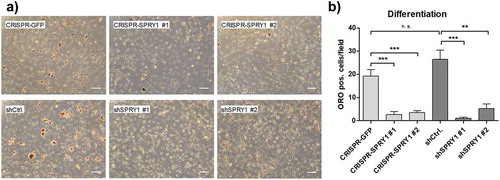
Figure 4. Oil Red O (ORO) staining of differentiated SPRY1 KO and KD ASCs on d14. CRISPR-GFP and shCtrl ASCs served as negative controls. (a) Representative images of one donor out of n = 4 different experiments (i.e., donors) are shown. Magnification 50x. Scale bar 200 µm. (b) Quantification of adipocytes corresponding to A). n = 5 images per condition were taken randomly and ORO positive cells were counted. Values are presented as mean ± SEM. Statistical comparison was done using the Two-tailed Unpaired t-test. All results correspond to the data presented in Figures 2 and 3 and were obtained in the same donor