Figures & data
Figure 1. (a) Confocal image of primary human adipocytes isolated from subcutaneous adipose tissue stained with Bodipy 493/503 (neutral lipids), showing small lipid droplets dispersed at the cell surface (dispersed droplets). d1 refers to the cells being isolated and stained the same day as the tissue was excised. (b) Same as in (a) except the adipocytes were kept in culture for 2 d (corresponding to d3) before fixation and staining. The image illustrates the appearance of lipid droplet clusters. (c) Confocal image of primary human adipocytes isolated d1 and kept in culture for 2 d (corresponds to d3, upper panel) or isolated after culturing intact adipose tissue 2 d (Tissue Culture, lower panel). Quantification of surface lipid droplet sizes in both conditions are shown in violin plot to the right, illustrating the increase in size following culturing of isolated adipocytes. (ac) Scale bar = 20 µm. (d) Electron micrograph of intact human adipose tissue (d1), showing the surface droplet phenotype in one adipocyte. (e) Micrograph of the same sample as in (d) showing caveolae structures (indicated with red arrows) at the plasma membrane of two adjacent adipocytes
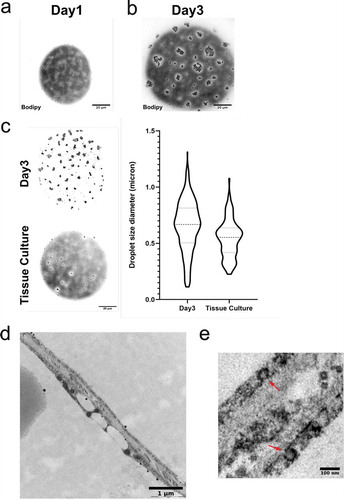
Figure 2. (a) Confocal image of an adipocyte stained with antibody against CIDEC (green) and Bodipy 493/503 (shown in red). (b) Confocal images of cells over-expressing CIDEC-GFP (green) stained with Bodipy colour-shifted into far red (Bodipy 665/676) (red). (ab) Scale bar = 20 µm. (c) Electron micrograph of cells exhibiting the droplet cluster phenotype, high-pressure frozen and labelled with immunogold against CIDEC (gold particles indicated with arrows)
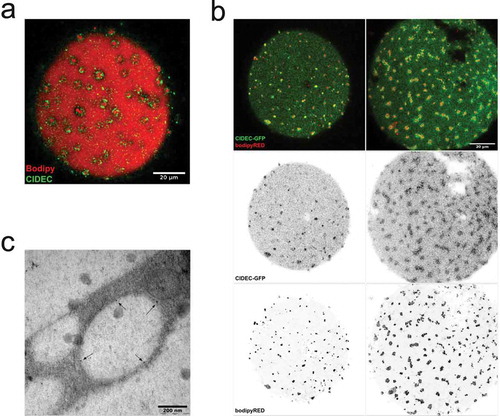
Figure 3. (a) Lipogenesis was determined in isolated primary human adipocytes, pre-incubated either 3 hrs or 24 hrs with Triascin C (TriC) 10 µM or vehicle (Methanol), in both non-stimulated (basal) or insulin-stimulated (15 nM) condition. N = 2 independent experiments (b) Confocal images of representative cells treated with either TriC (2 µM) or vehicle (control, CTRL) for 48 hrs followed by fixation and Bodipy 493/503 labelling. (c) Lipolysis (glycerol release) measured in isolated primary human adipocytes, pre-incubated 72 hrs with Acipimox (20 µg/ml) or vehicle (H2O), non-stimulated (basal) or isoprenaline-stimulated (10 nM) for 30 min. (d) Confocal images of representative cells treated with either Acipimox (20 µg/ml) or vehicle (control, CTRL) for 48 hrs followed by fixation and Bodipy 493/503 labelling. Scale bar = 20 µm
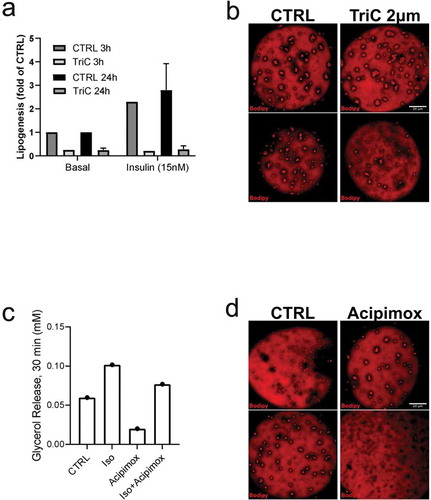
Figure 4. (a) TIRF images of primary adipocytes overexpressing EHD2wt, either non-stimulated (CTRL, left panel) or stimulated with isoprenaline (ISO, right panel) 100 nM for 30 min, fixed and stained with antibodies against pHSL(pS563) and perilipin-1 (pS522). (b) Long-term stimulation (24 hrs) with either isoprenaline (ISO, 10 nM) or insulin (INS 10 nM), or non-stimulated (control, CTRL). Scale bar = 20 µm
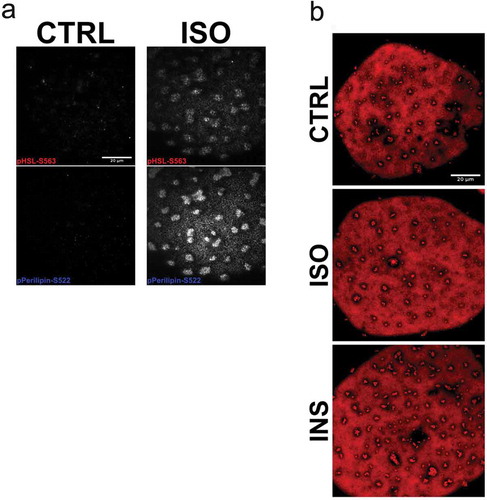
Figure 5. (ab) Confocal images of isolated adipocytes stained with MitoTracker (mitochondria, shown in white) and Bodipy 493/503 (neutral lipids, red). Scale bar = 20 µm. (c) Electron micrograph of high-pressure frozen cells exhibiting the droplet cluster phenotype. Mitochondria (indicated with red arrows) located in the vicinity of the droplets
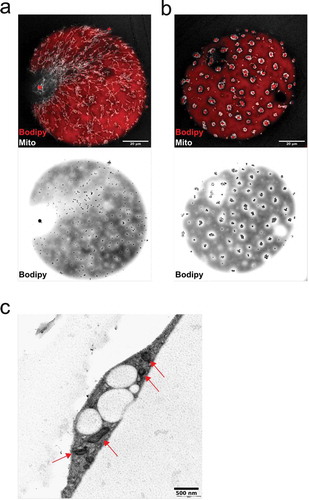
Figure 6. (ab) Confocal images of isolated adipocytes incubated with bodipy 558/568 C12, followed by staining with bodipy 493/503 and MitoTracker deep red. Upper panel is bodipy (green, neutral lipids) and MitoTracker (mitochondria, red), lower panel shows bodipy 558/568 C12 (red-white). Images illustrates the presence of the lipid analogue bodipy 558/568 C12 in small droplet clusters, the central lipid droplet and in mitochondria. Scale bar = 20 µm
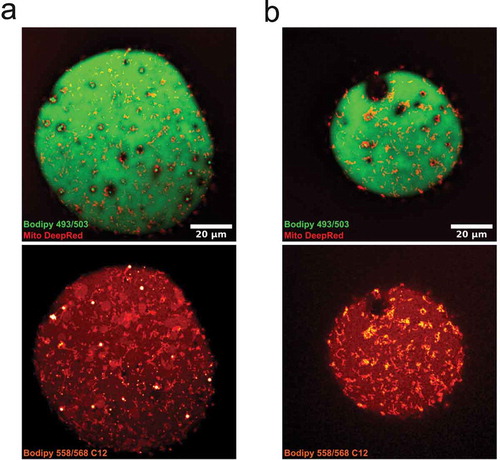
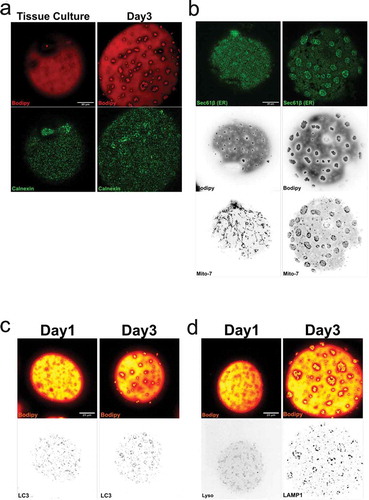
Figure 7. (a) Cells isolated either from tissue culture, or cells isolated and cultured for 2 d (d3) were fixed and stained for calnexin (green) and Bodipy 493/503 (red). (b) Overexpression of the ER-marker Sec61β shows structural elements all over the cell, but with an increase in signal around the clusters. Mitochondria (Mito-7) follow the same distribution pattern as in figure around the droplet clusters. (c-d) Isolated adipocytes fixed and stained with antibody against LC3, LAMP1 and bodipy 493/503 (red), either d1 (left panel) or after 2 d of culturing (d3, right panel). Scale bar = 20 µm