Figures & data
Figure 1. Characteristics of hADSCs (a) Representative micrographs show the fibroblast-like morphology of hADSCs at P3. Scale bar: 100 μm. (b) The expression level of CD105, CD73, CD90, HLA-DR, CD34, and CD45 in hADSCs as measured by flow cytometry analysis. Blue lines represent cells stained with corresponding isotype control, and red lines represent cells stained with individual antibody. hADSCs, human adipose-derived stem cells. (c) Representative micrographs of hADSCs multi-differentiation function identified by Oil Red staining , chondrocytes by Alcian Blue stain, osteocytes by Alizarin Red staining. Scale bar: 100 μm
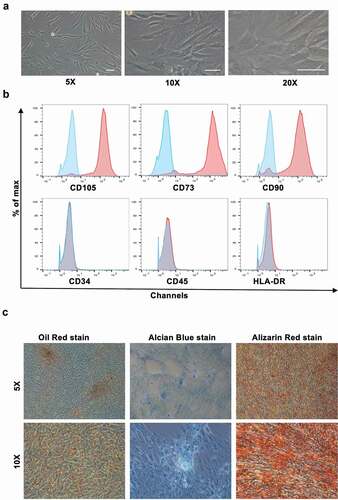
Figure 2. Identification of deletion of SENP1 in hADSCs. (a) (b) The protein expression of SENP1 was detected by western blot analysis. Data presented are the mean ± SD of three independent experiments (*P < 0.05). (c) Immunofluoresence analysis of SENP1 expression in CON and KO respectively. SENP1, small ubiquitin-related modifier protein-specific protease 1; CON, hADSCs; KO, SENP1 Knockout
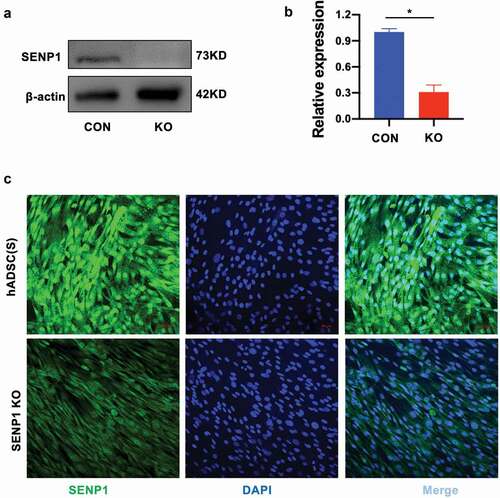
Figure 3. Effect of SENP1 knockout on morphology and surface markers of hADSCs. (a)Representative micrographs show the morphology of SENP1 knockout in hADSCs, Scale bar: 100 μm. (b)Immunophenotypes of SENP1 knockout in hADSCs. Blue lines represent cells stained with corresponding isotype control, and red lines represent cells stained with individual antibody
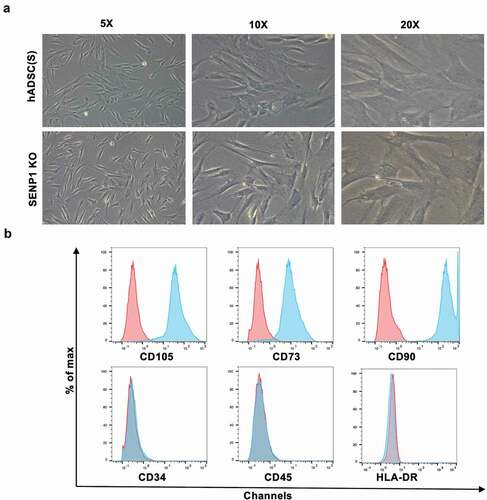
Figure 4. Effect of SENP1 knockout on migration and proliferation of hADSCs. (a) (b) Representative images of scratch assays recorded at 0 h and 10 h of SENP1 knockout in hADSCs. Data are shown as the means ± SD (*P < 0.05). (c) The proliferation of hADSCs after knockout SENP1 was detected by CCK-8 assays. (d) (e) Flow cytometry assays of cell cycle distribution
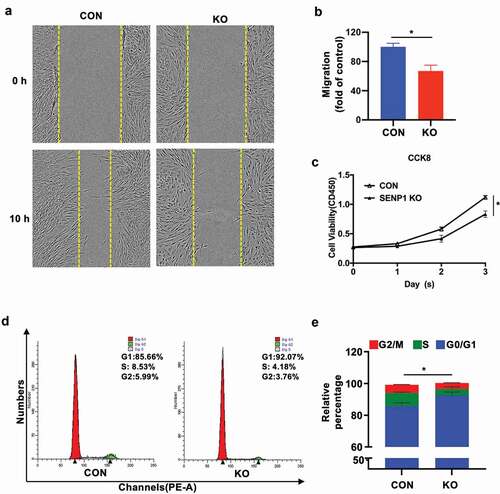
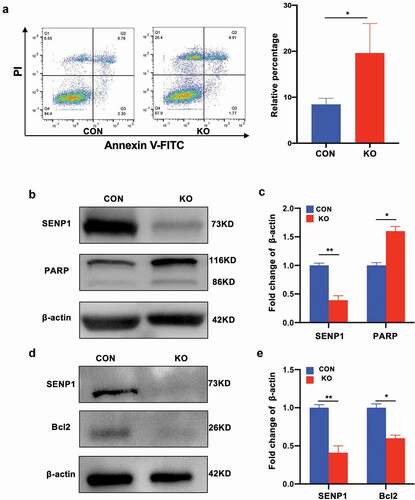
Figure 5. Effect of SENP1 knockout in apoptosis of hADSCs. (a) Flow cytometry was used to detect the apoptosis of hADSCs. (b) (c) (d) (e) the protein expression of apoptosis markers was detected by western blot analysis. Data are shown as the means ± SD (*P < 0.05, **P<0.01)