Figures & data
Figure 1. Study flowchart. 1a) GEA study. Diabetes defined as glucose >7.0 mmol/L, hypoglycaemic treatment or previous diagnosis; hypertension as self-reported treatment with antihypertensive medications or systolic/diastolic blood pressure ≥140/90 mmHg; subclinical atherosclerosis as coronary artery calcium >0; non-alcoholic fatty liver disease as spleen-liver attenuation ratio <1.0; and low HDL-cholesterol as values <1.03 mmol/L or <1.29 mmol/L for men or women; respectively. 1b) Study of the adipose tissue functionality. HOMA-IR: homoeostatic model assessment of insulin resistance; HDL: high-density lipoprotein
Figure 2. Correlation of dysfunctional adiposity index with functional (2a) and morphological (2b) characteristics of adipose tissue in 36 healthy subjects. * Spearman correlation coefficient, the shaded area represents the 95% confidence interval
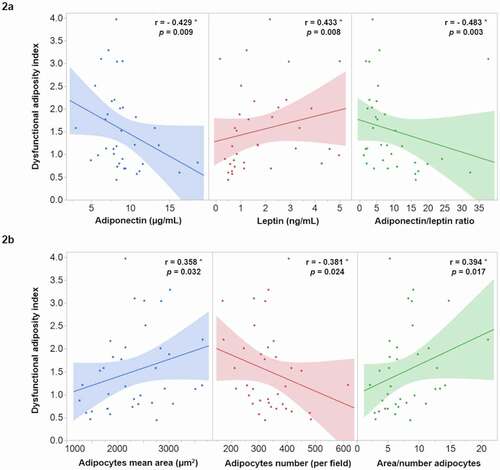
Figure 3. Correlation of dysfunctional adiposity index with systematic inflammation markers in 36 healthy subjects. hs-CRP: high-sensitivity C-reactive protein; IL: interleukin; MCP-1: monocyte chemoatractant protein-1. * Spearman correlation coefficient, shaded area represents the 95% confidence interval
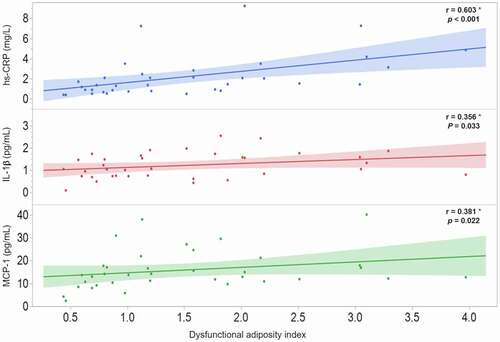
Figure 4. Receiver operating characteristic (ROC) curve to predict the homoeostatic model assessment of insulin resistance (HOMA-IR) ≥2.09. AUC: area under the curve; SE: standard error; CI: confidence interval. * This represents the median value in 36 healthy subjects
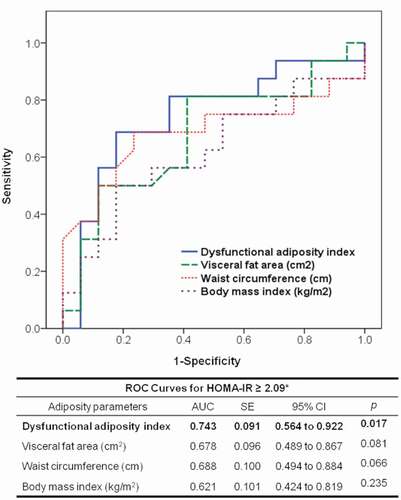
Table 1. Clinical and biochemical characteristics of subjects (n = 1418) without history of coronary arterial disease
Figure 5. Association of high dysfunctional adiposity index (>1.065) with cardiometabolic abnormalities in 1418 subjects without a history of cardiovascular disease. Diabetes is defined as glucose >7.0 mmol/L, hypoglycaemic treatment or previous diagnosis; non-alcoholic fatty liver disease as spleen-liver attenuation ratio <1.0; subclinical atherosclerosis as coronary artery calcium >0, and hypertension as self-reported treatment with antihypertensive medications or systolic/diastolic blood pressure ≥140/90 mmHg. * Multiple logistic regression analysis adjusted by age, sex, and tobacco use