Figures & data
Figure 1. Fat measurements on CT. Subcutaneous fat (SFA, purple area) and Visceral fat (VFA, red area) were segmented after outlines (yellow line) were placed in the abdominal skeletal muscle from the original CT image for automatic calculation
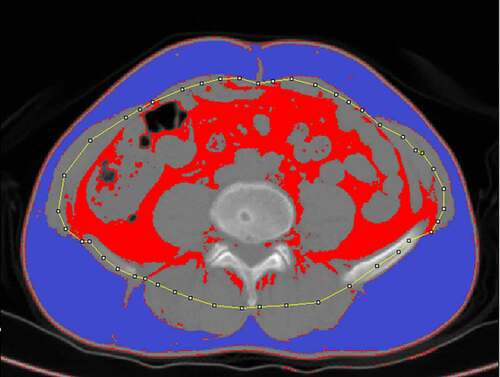
Table 1. The baseline characteristics and fat measurements of patients stratified by T stage
Figure 2. Representative radiographic and histological images of patients. (a-c) Low-T-stage ccRCC in a 49-year-old woman. (d-f) High-T-stage ccRCC in a 54-year-old woman. (a) Enhanced CT showing right renal tumour (white arrow). (b) CT image with a relative visceral fat area (rVFA) of 18.2%. (c) Histologic photomicrograph confirming that the tumour did not involve capsule so as to be T1 stage. (d) Enhanced CT showing right renal tumour (white arrow). (e) CT image with a relative visceral fat area (rVFA) of 35.0%. (f) Histological micrographs confirming that the tumour involved the capsule, but was confined to the perirenal fascia so as to be T3 stage
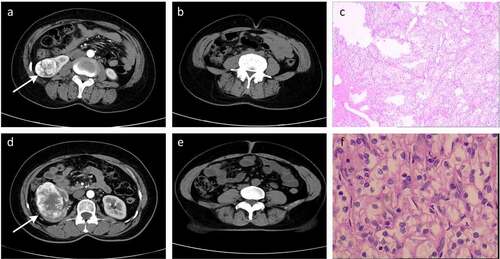
Table 2. Univariate and multivariate models for predicting ccRCC T stage
Figure 3. The relative visceral fat area (rVFA) was significantly different in both males (a) and females (b) based on T stage
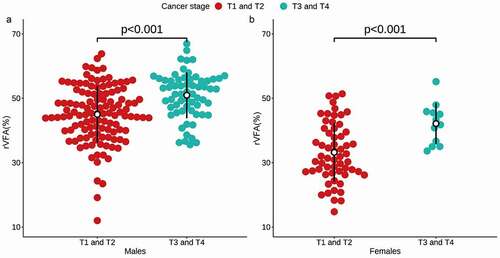
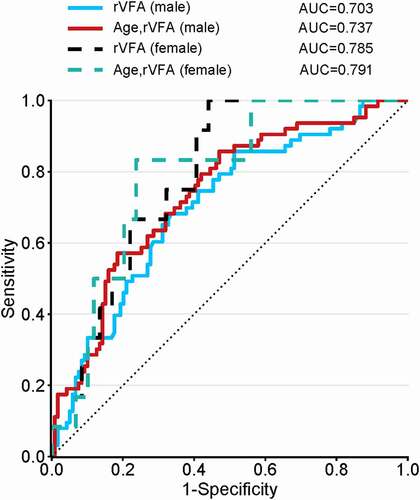
Figure 4. Comparisons of ROC curve analysis for univariate and multivariate models. Both the rVFA in males (blue solid line) and females (black dotted line) demonstrated good predictive power. In multivariate model incorporating age, good predictive power of rVFA was also observed irrespective of sex